A new version of the Grant Manager Dashboard is now available, which improves visibility into outstanding invoices for grants in Closeout in Progress or Expired status. These enhancements highlight invoices that require attention and help Grant Managers take timely action, ensuring compliance and preventing delays.
This article introduces these enhancements and explains how to access them within the Grant Manager Dashboard.
About the Grant Manager Dashboard
The Grant Manager Dashboard displays grant data, which is tailored to the Grant Manager logged into Workday. This gives Grant Managers a central place to find grant-related content that is specific to them.
This dashboard splits data across six tabs—Sponsored Grants, Awards, Stand Alone Grants, Gifts, Sponsored Grant Staffing, and Additional Resources.
Note: If working offsite, you must connect to Husky OnNet (VPN) to access the above link. For more information, refer to Husky OnNet.
About the Enhancements
Note: A one-time configuration is required in order to use the following enhancements. For more information, refer to the Grant Manager Dashboard Job Aid.
Flags
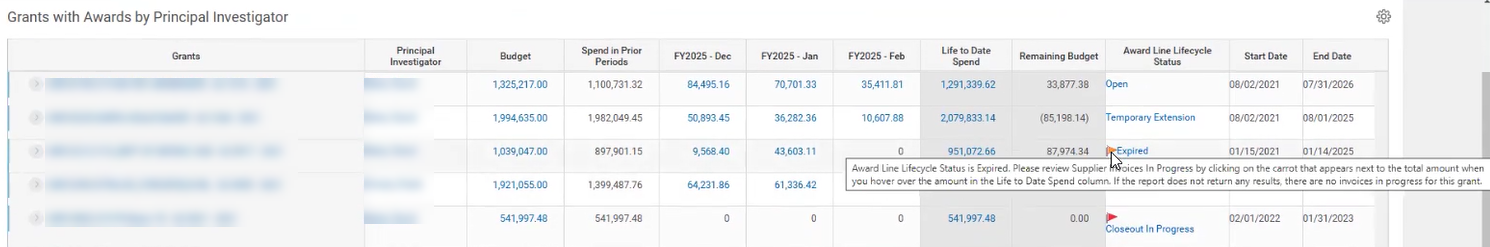
The Sponsored Grants tab now uses flags to highlight grants with an Award Line Lifecycle Status of Closeout in Progress or Expired. Hovering over these flags reveals recommended next steps.
Supplier Invoices in Progress Report
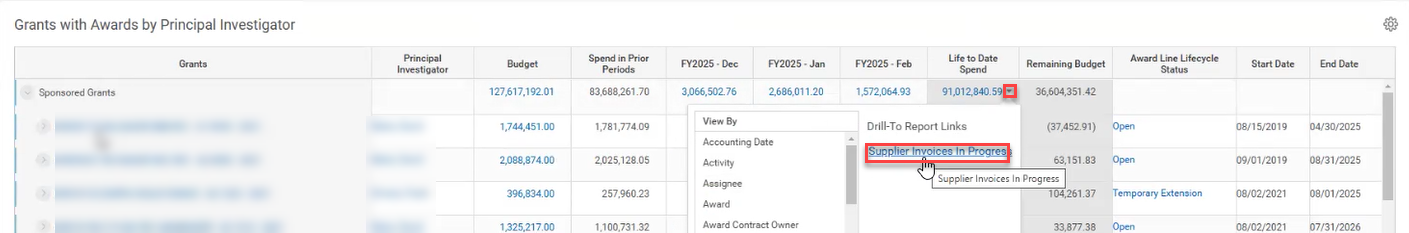
Grant Managers can now identify invoices that require their attention by clicking the down arrow next to a value in the Life to Date Spend column and selecting the Supplier Invoices in Progress link.
This displays a report of invoices in In Progress or Draft status for the selected grant(s). Monitoring these invoices is especially important for grants in Closeout in Progress or Expired status, as they should not have open supplier invoices.
Questions?
Please contact datagrp@uw.edu to initiate a ticket with the Finance DATAGroup.
The University of Washington is committed to creating a welcoming and respectful learning, working, and living environment. In support of this commitment—and in compliance with Washington state law (Senate Bill 5227)—the UW offers Cultivating Community at UW: Anti-Racism and Diversity, Equity, Inclusion, and Belonging (DEI&B). This 2.5-hour online course educates our community on topics such as racism, disability and accessibility, and LGBTQ+ identities; highlighting how these issues affect colleagues and students at the UW. The module-based format allows participants to complete the training at their own pace.
This course is required for new employees hired after June 30, 2022, who have not worked at the UW in the preceding 12 months. It must be completed within 30 days of their hire date. While optional for other employees, participation is strongly encouraged, with a long-term goal of at least 80% of staff, faculty, and other academic personnel completing the training every two years. For more information about this training requirement, refer to Anti-Racism and DEI&B in the Workplace.
To enhance the effectiveness of this program, UW-IT’s Reporting & Analytics team partnered with staff in the Office of Minority Affairs & Diversity (OMA&D) to develop a new dashboard, which is now available in the BI Portal! This dashboard tracks completion records for the anti-racism and DEI&B training (grouped by required and optional employees), identifies areas for additional outreach, and supports compliance with this crucial requirement.
Collaborating to Meet Requirements
Creating this dashboard was a team effort! OMA&D staff provided the requirements and feedback, while folks in the Reporting & Analytics Web Applications and Business Intelligence (BI) teams pulled the data from various sources to develop the dashboard.
Understanding the Data Pipeline
BI Portal resources usually rely on data from the Enterprise Data Warehouse (EDW), but this dashboard needed additional data sources. Training completion records from the Bridge Learning Management System (LMS) were combined with employee data from the EDW and Workday in Snowflake, a cloud-based data warehousing platform.
With the data view available, the dashboard was built in Tableau and fine-tuned in partnership with OMA&D to ensure it met user needs. The team thoroughly tested it to confirm everything worked smoothly and accurately before rolling it out.
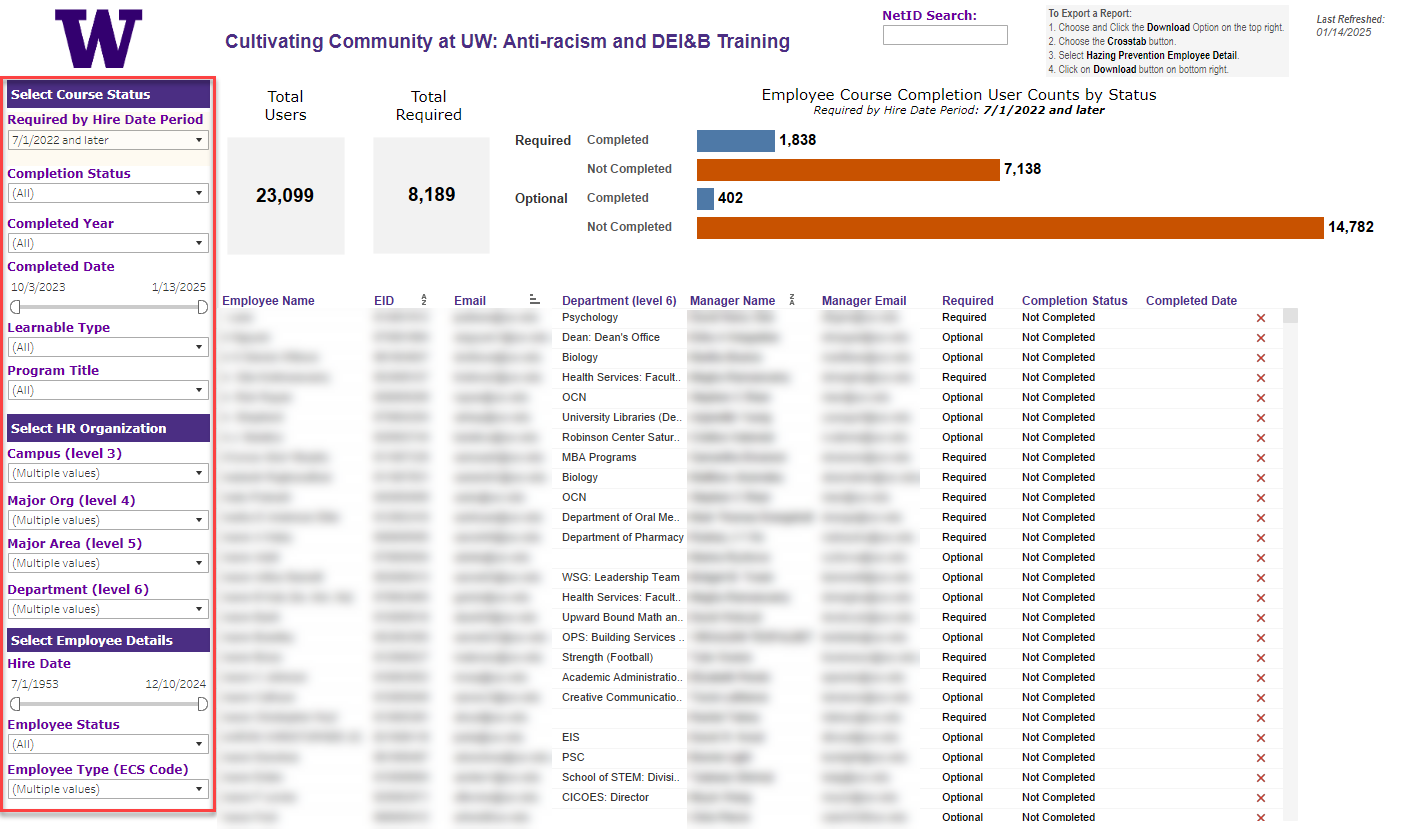
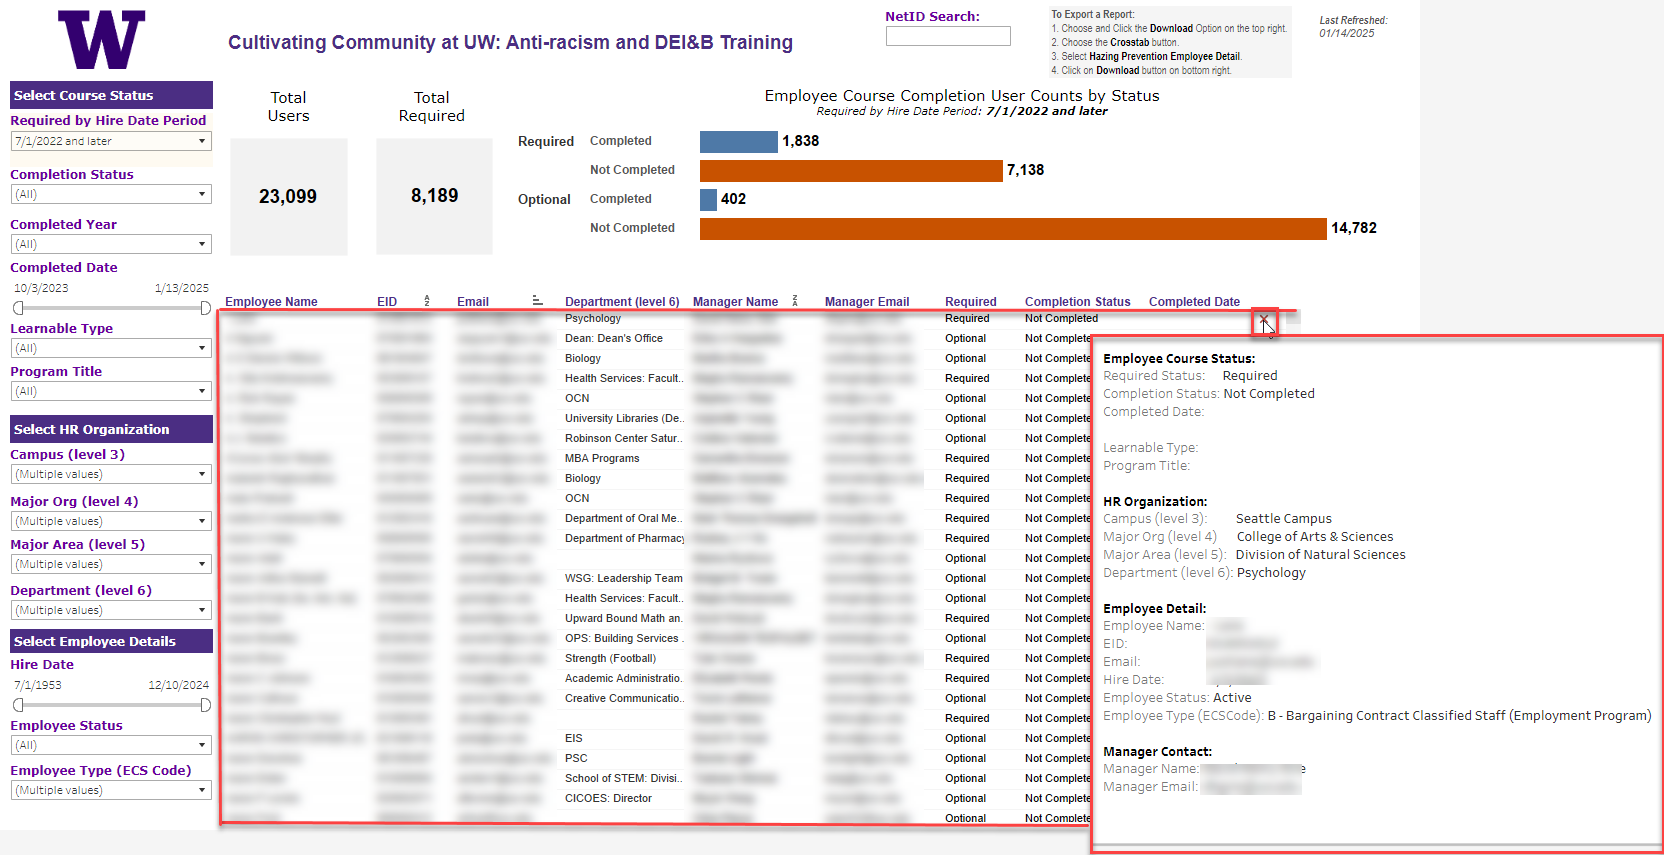
The left panel of the dashboard provides a number of filters, which allow users to narrow results by course status, employee details, and/or various levels of the HR Hierarchy. For more information about these filters, refer to the Filters tab for the dashboard in the BI Portal.
Search
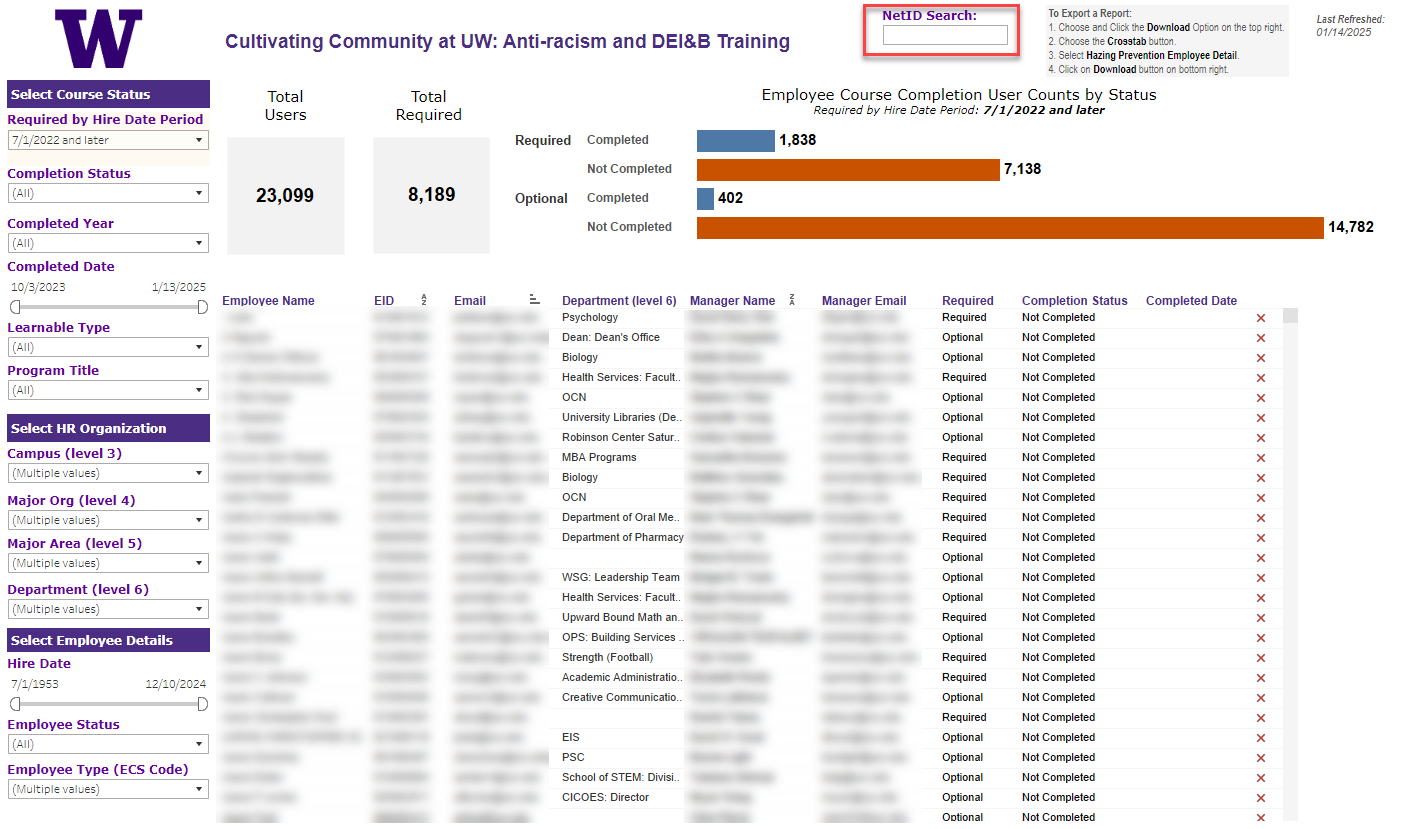
The top of the dashboard provides a search field, which allows users to search for a specific employee by UW NetID.
Results
The center of the dashboard displays the results, based on the filter or search specifications. Additionally, each row includes the completion status, indicated with a check mark (✔) or crossmark (X) icon. You can hover over these icons to display a tooltip with additional context, such as course status, HR organization, employee detail, and manager contact information for a specific employee.
A screenshot of the dashboard with a red box around the results and a tooltip.
Questions/Feedback/Ideas?
Do you have a question about this dashboard and/or a request for a new resource in the BI Portal? Please submit a ticket to help@uw.edu with “BI Portal” in the subject line.
We’re thrilled to announce the release of the Grant Spend Verification Tool—a solution that simplifies grant expense tracking and compliance. This tool provides a clear view of expenses by grant and fiscal period, streamlines the verification process with built-in commenting and electronic signatures, and securely stores records for the required retention periods. With this tool, reviewing your grant expenses and staying in compliance is more efficient, transparent, and reliable.
Collaborating to Meet Requirements
Creating this tool was a true team effort!
DATAGroup (UW Finance Planning & Budgeting) provided subject matter expertise, gathered user requirements, and shared feedback to guide development.
Business Intelligence (UW-IT) built a report to meet user, security, and metadata requirements.
Enterprise Document Management (UW-IT) integrated DocuSign and DocFinity to enable verification and storage.
Additionally, finance reporting users from the School of Medicine, College of Education, and College of the Environment participated in User Acceptance Testing, helping to identify issues, provide feedback, and refine the tool.
About the Solution
The Grant Spend Verification tool leverages the BI Portal, DocuSign, and DocFinity. Here’s an overview of how it works.
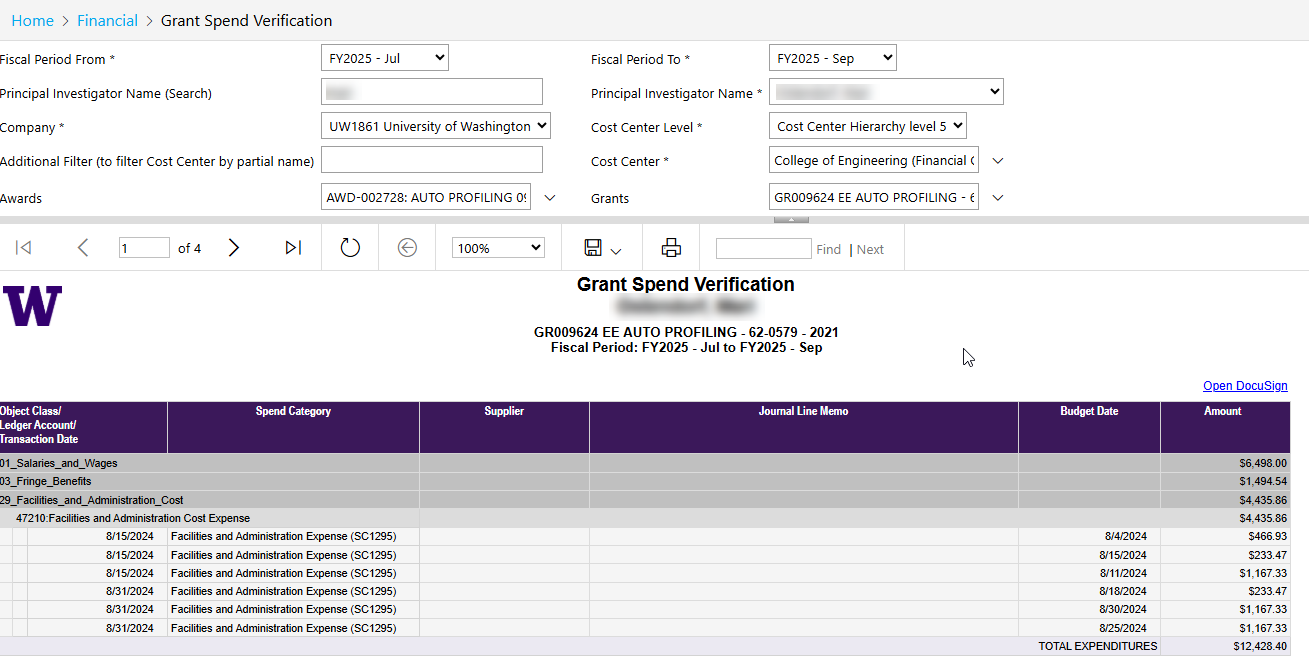
Step 1: Run the Report (BI Portal)
The Grant Manager initiates the Grant Spend Verification process by running the Grant Spend Verification report in the BI Portal. This report shows expenses by grant and fiscal period for a Principal Investigator.
Example: Grant Spend Verification Report in the BI Portal
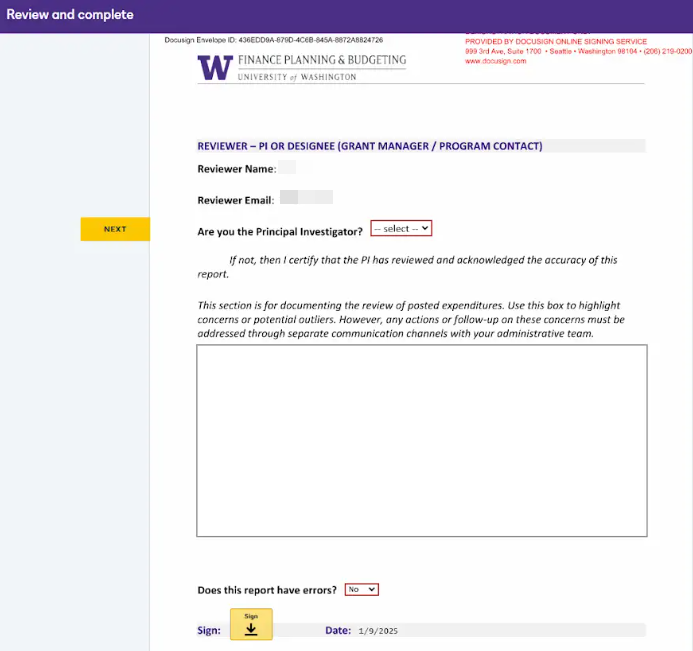
Step 2: Review and Verification (DocuSign)
The Grant Manager routes the report through DocuSign for PI (or designee) review. The PI is notified, reviews the report, adds comments if needed, and signs electronically to verify the report.
Example: DocuSign Form for PI or Designee Verification
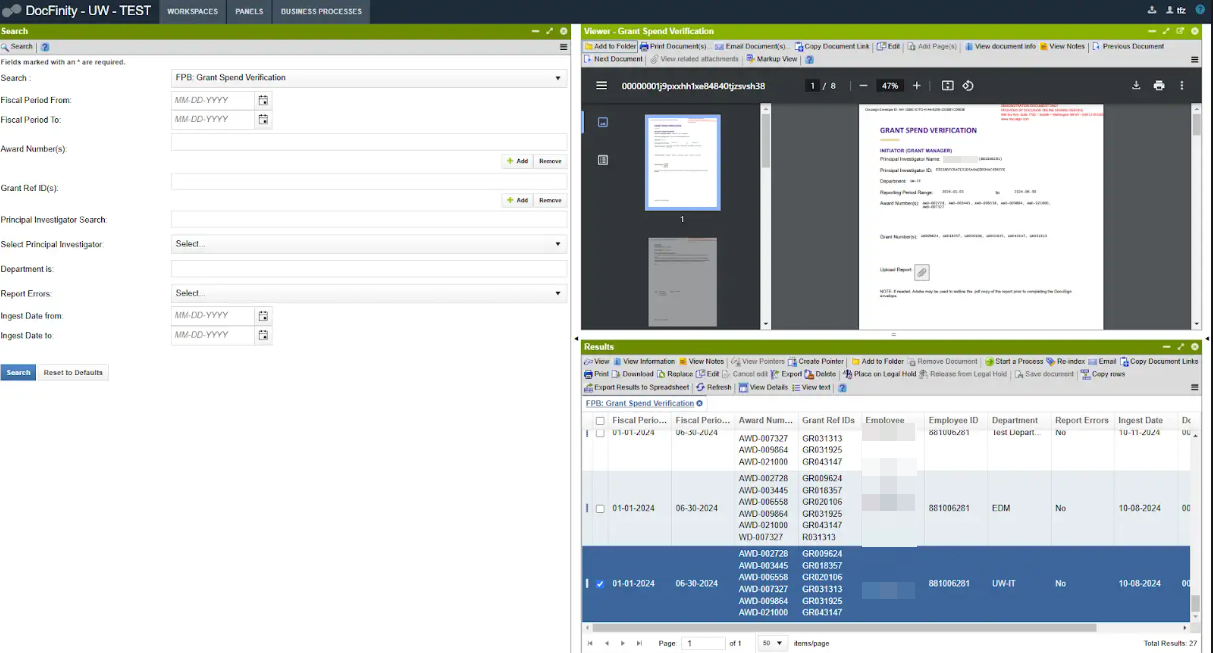
Step 3: Document Retention (DocFinity)
Once finalized, the verified document is stored in DocFinity, an electronic document storage solution, for secure access throughout its retention period.
Example: DocFinity Electronic Storage
This end-to-end process ensures compliance while saving time and effort across departments. To get started and for more detailed instructions, refer to the Grant Spend Verification job aid.
Note: If working offsite, you connect to Husky OnNet (VPN) to access the above link. For more information, refer to Husky OnNet.
Need Support?
If you have questions and/or would like to request a demo or training session for your department, please email datagrp@uw.edu with “Grant Spend Verification” in the subject line. We’re here to help!
The student database (SDB) will go through a reorganization on February 1, 2025 which will cause changes in the Enterprise Data Warehouse database, UWSDBDataStore. These changes to the objects will be available in the UWSDBDataStore on February 3, 2025
However, data on the new objects will be available as soon as the Data Custodians submit the security role definitions and the SIS team loads the data.
Last Updated – 1.30.2025
Columns to be Added
Table
Column
DataType
SF_EVALUATION1
PROF_JUDGE_DATE
datetime
STUDENT_1
TOT_NONGRD_ATTMP
decimal(4,1)
TRANSCRIPT
QTR_NONGRD_ATTMP
decimal(3,1)
Columns to be Removed
Table
Column
SF_EVALUATION
COFH_INDICATOR
Note: This column removal also impacts sec.FinAidSfEvalSubset
Field moving from SF_Evaluation1 to SF_Evaluation:
INST_SAI_BLK
We’re excited to share a major enhancement in Workday: embedded reports are now available directly within Award, Grant, Cost Center, and Gift worktags! This update simplifies workflows by providing instant access to balances, activities, and budget-to-actuals data. With this enhancement, users are able to view relevant worktag data in one place, without needing to run separate reports!
This article breaks down these enhancements by worktag and explains how to display these new reports within the Workday interface.
Award Worktag
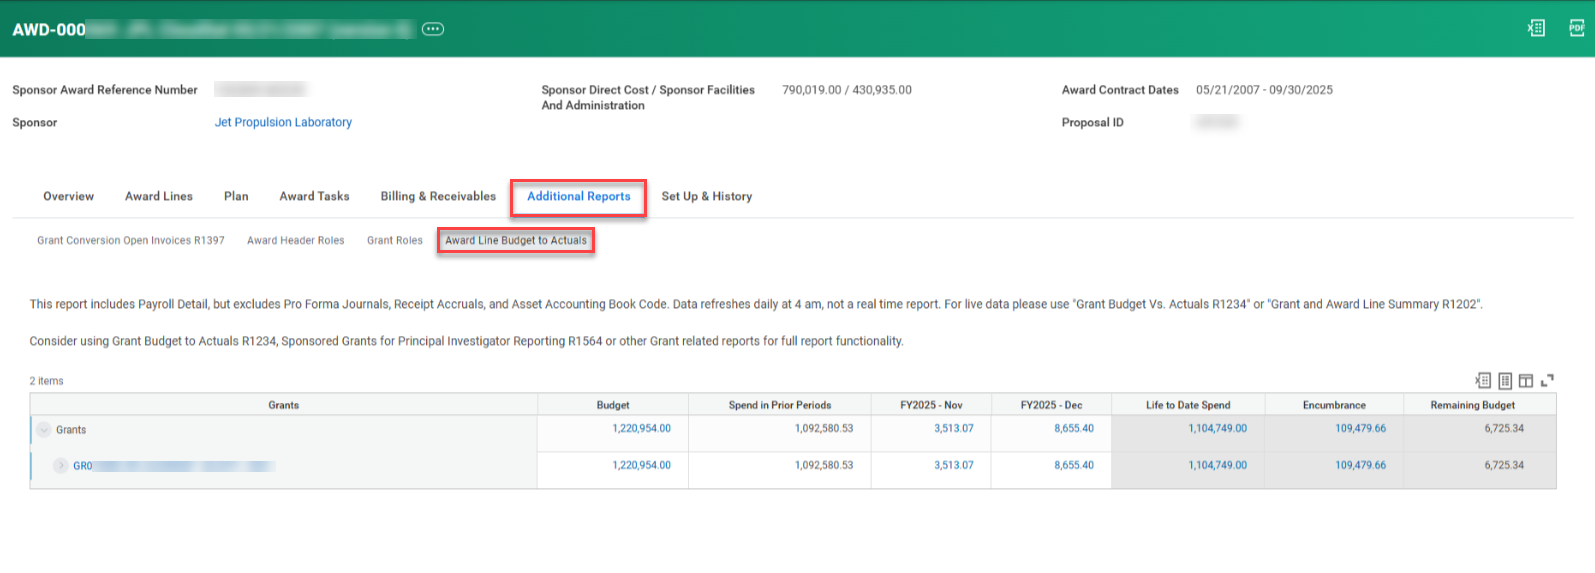
The Award Line Budget to Actuals report is now embedded within the Award worktag. This report provides some grant attributes, budget, life-to-date spend, encumbrance balance, and remaining balance data. This is the same report that is on the Sponsored Grants tab of the PI and Grant Manager Dashboards.
To find this report, display an award worktag, click the Additional Reports tab, and then click the Award Line Budget to Actuals report.
Grant Worktag
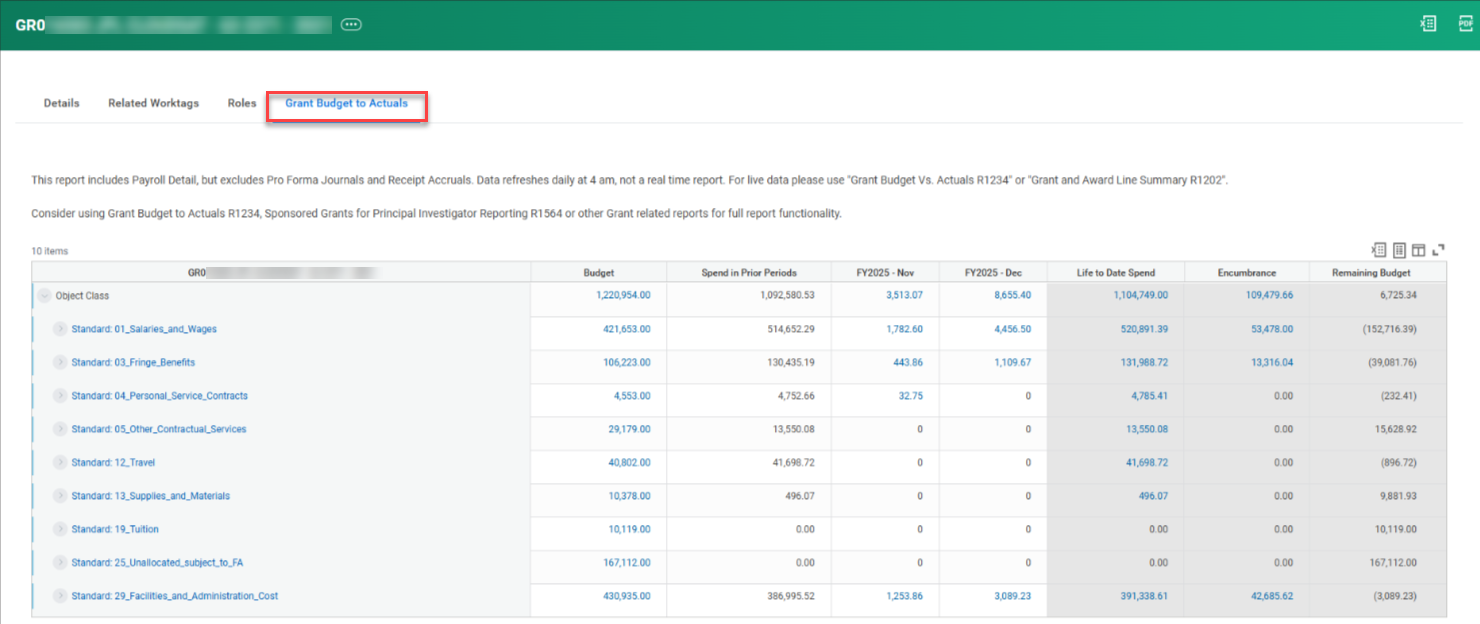
The Grant Budget to Actuals report is now embedded within the Grant worktag. This report provides some grant attributes, budget, life-to-date spend, encumbrance balance, and remaining balance data. This is the same report that is on the Sponsored Grants tab of the PI and Grant Manager Dashboards.
To find this report, display a grant worktag and click the Grant Budget to Actuals tab.
Cost Center Worktag
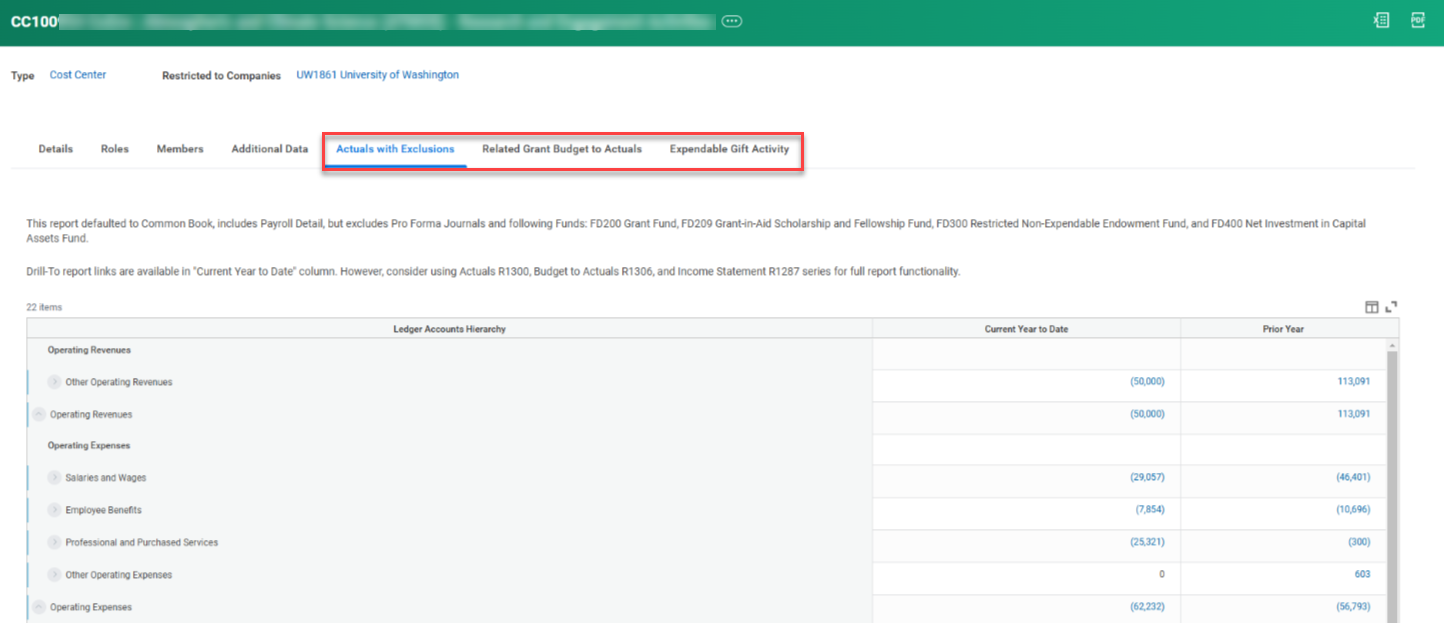
There are three new reports now embedded within the Cost Center worktag:
Actuals with Exclusions – This report provides beginning balance, activity by high-level category, ending balance, and encumbrance balance data. This report defaults to Common Book and excludes FD200, FD209, FD300, and FD400.
Related Grant Budget to Actuals – This report provides some grant attributes, budget, life-to-date spend, encumbrance balance, and remaining balance data. It returns transactions where the Cost Center is used with any Grant worktag. Note that the Default Cost Center on individual Grants may be different. This is the same report that is on the Sponsored Grants tab of the PI and Grant Manager Dashboards.
Expendable Gift Activity – This report provides some gift attributes, beginning balance, net change in net position, ending balance, and encumbrance balance data. It returns transactions where the Cost Center is used with any Gift worktag. Note that the Default Cost Center on individual Gifts may be different.
To find these reports, display a cost center worktag and then click the applicable tab: Actuals with Exclusions, Related Grant Budget to Actuals, or Expendable Gift Activity.
Gift Worktag
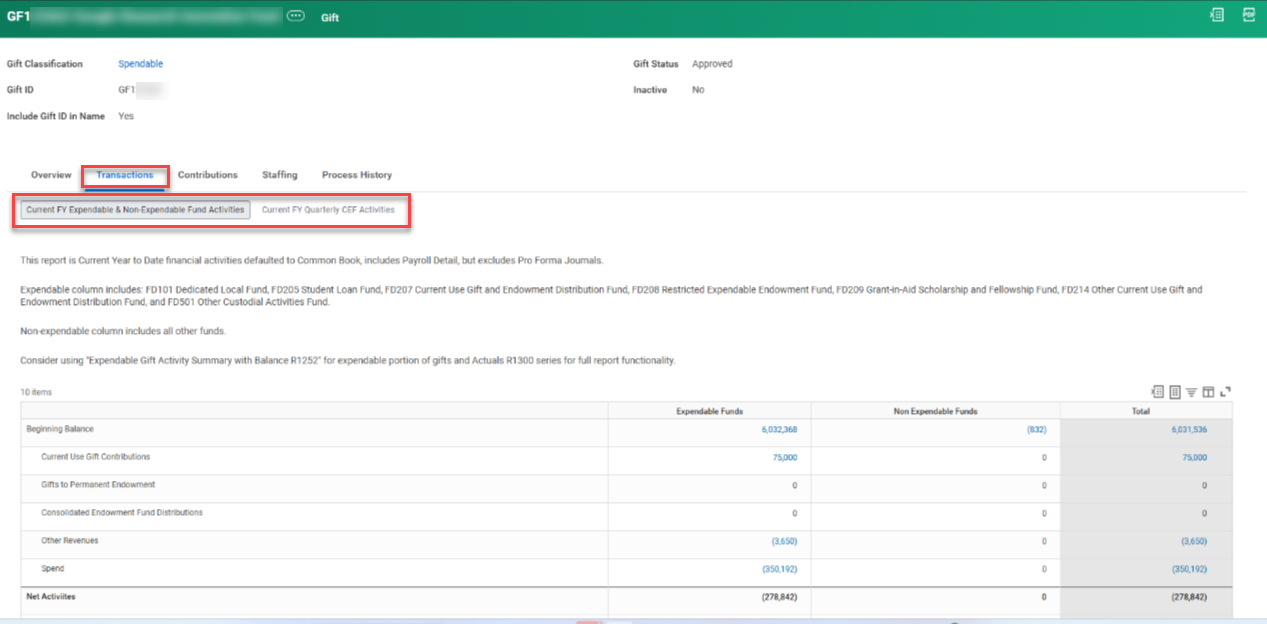
There are three new reports now embedded within the Gift worktag:
Current FY Expendable & Non-Expendable Fund Activities – This report provides beginning balance, activity by high-level category, ending balance, and encumbrance balance data. This report defaults to Common Book and splits columns into Expendable and Non-Expendable Funds.
Current FY Quarterly CEF Activities – This report provides beginning balance, net change in units and amounts grouped by FY quarters, and ending balance data. This report is only applicable for pooled gifts.
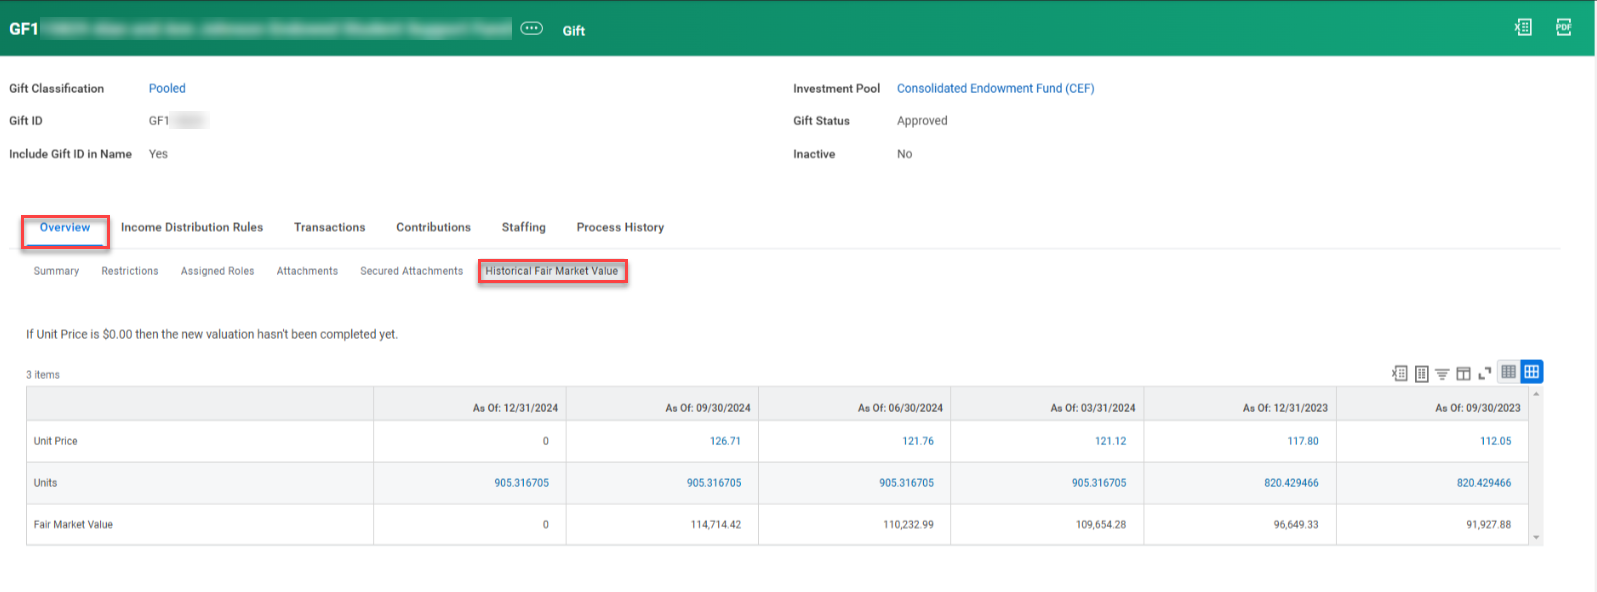
Historical Fair Market Value – This report provides valuations for the last 6 quarters. This report is only applicable for pooled gifts.
To find the Current FY Expendable & Non-Expendable Fund Activities and Current FY Quarterly CEF Activities reports, display a gift worktag, click the Transactions tab, and then click the applicable report: Current FY Expendable & Non-Expendable Fund Activities or Current FY Quarterly CEF Activities.
To find the Historical Fair Market Value report, display a pooled gift worktag, click the Overview tab, and then click the Historical Fair Market Value report.
Questions?
Please contact datagrp@uw.edu to initiate a ticket with the Finance DATAGroup.
Have you ever spent hours on a repetitive data task—perhaps it’s a quarterly report or a response to a frequent inquiry—only to wonder, “Is this the best use of my time?”
Are you populating forms, cleaning up spreadsheets, or cross-referencing numbers? What could you accomplish if these processes were streamlined or even automated? More time for strategic projects? Campus outreach? Maybe just a chance to step back and focus on the big picture?
This is where the Business Intelligence (BI) team comes in. We specialize in transforming how you access and use data. Through reports, cubes, and dashboards, we simplify processes, automate workflows, and ensure enterprise data is at your fingertips—limited, of course, to the data you have permission to access. Rooted in partnerships across campus, our work evolves through collaboration, uncovering needs, solving problems, and building solutions that scale with users over time.
A Year in Review: Highlighting Our Work with GCA
While we deliver solutions for many groups across campus, a standout partnership this year has been with Grant and Contract Accounting (GCA). This partnership showcases a variety of solutions, made possible through iterative development, clear communication, and the expertise of several teams across campus.
A special thanks to the following groups within UW Finance, Planning & Budgeting for their time and expertise, which were essential for our work with GCA:
DATAGroup – Provided subject matter expertise on finance and grant data.
Shared IT Services (specifically Nate Ayres) – Migrated legacy data to the Central Finance Reporting Database (CFRDB) and created views within this database for cross-era reporting.
This section highlights many of the BI solutions delivered for GCA in 2024.
Federal Financial Report (SF425) Suite
The SF425 report, or Federal Financial Report, standardizes the submission of financial data for individual grant awards, ensuring compliance with federal reporting requirements. Submitting the SF-425 form is essential to comply with regulations, maintain funding, secure future grants, and preserve strong agency relationships—without the SF425 report, there is no funding.
Previously, GCA manually populated these reports, which was time-consuming, error-prone, and complicated by the need for cross-era data in the post-Finance Transformation environment.
The BI team’s solutions have streamlined this process, providing three SF425-related tools in the BI Portal to support submission requirements.
Federal Financial Report (SF425) – This report generates two outputs, which capture a grant’s cumulative expenses. Outputs include:
A completed SF425 form, with data in the correct format
Close Out Documents (PI Letter, Primary/Non-Primary Detail, and Close Out Actions)
Federal Financial Report (SF425) NASA – This report consolidates all NASA Federal Financial Reports (covering approximately 90 UW awards) into a single file for bulk upload. NASA is the only sponsor that accepts this format.
SF425 – Bulk Process – This report generates a file that lists all awards, including metadata, that meet the selected parameters and have an Award Task Status of Not Started. This file is then used in an automated flow to produce SF425 report PDFs for each award without manual input.
Report of Expenditures (ROE)
Similar to the SF425 suite, the Report of Expenditures (ROE) automates a previously manual process for non-federal UW financial reporting when no sponsor format exists.
To support cross-era reporting, this interim ROE report supplements the Workday ROE report (July 2023 – present) by providing the legacy data needed for interim ROE reporting.
Calculated vs. Actual Indirect Cost Report
This report helps users ensure actual indirect costs (IDC) for a budget were calculated correctly. This report compares IDC transactions to the calculated IDC rate and the budget’s actual Facilities and Administration (F&A) expenditures. This allows users to determine whether IDC expenses for a Workday award were calculated correctly or if an adjustment is required.
Federal Interest by Federal Grant
This report tracks daily interest earned on federally funded grants when cash on hand exceeds expenditures. The University owes interest on the difference, calculated daily and remitted annually to the federal government. This one report replaces two reports that were used in the pre-Workday era: Total Interest by Federal LOC Grant and Total Interest by Federal Invoiceable Budget.
Legacy System Retirement Reports
As part of the broader UW-IT initiative to retire legacy systems, the BI team collaborated with GCA to ensure continued access to BGT and FIN/FAS data in preparation for the retirement of these systems. The following reports were created through this collaboration:
Grant and Contract Accounting Budget Revisions Report (BGT)
Budget Number Index Audit Trail (FIN/FAS)
A Report Tag to Tie it All Together
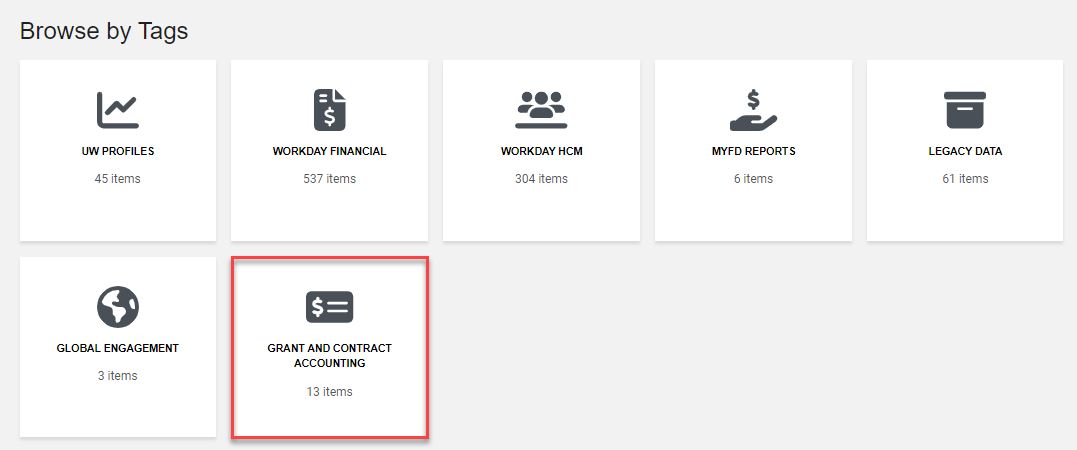
With all the new reports in GCA’s toolbox, they needed a better way to manage them. To do this, a Grant and Contract Accounting tag was added to quickly drill-down to GCA reports, including all of the new reports mentioned above. This tag is available as a tile on the BI Portal Home page and also as a filter on the Catalog page.
The Grant and Contract Accounting Tile on the BI Portal Home Page
Questions/Feedback/Ideas?
Would you like to partner with Business Intelligence on a report, cube, or dashboard? Please submit a ticket to help@uw.edu with “BI Portal” in the subject line.
Thanks to collaboration between UW-IT’s Reporting & Analytics, Web Applications team and FPB: Budget, Planning, & Operations (BPO), the BI Portal report catalog now includes Workday Adaptive Planning reports!
The updates deployed to the BI Portal on 12/4/24.
What is Workday Adaptive Planning?
Workday Adaptive Planning is a cloud-based financial planning and analysis tool, which:
Resides within the Workday platform, leveraging data from both the Workday HCM and Finance modules.
Provides comprehensive insights for streamlined planning and budgeting processes.
Delivers accurate and complete financial information.
Supports the development of UW’s annual operating budget.
The goal of BI Portal reports, cubes, and dashboards is to:
Reflect data from various subject areas: academics, advancement and alumni relations, core data, finance, human resources, property and space management, and research.
Include historical data.
Allow users to discover any report in the catalog. While a user’s Workday security role determines which reports they can run, the BI Portal allows users to discover all available reports and view security information regardless of role.
Bringing Workday Adaptive Planning reports into the BI Portal aligns with the broader reporting strategy for UW Academy, which is to provide users with a one-stop-shop for all reporting needs.
Accessing Workday Adaptive Planning Reports in the BI Portal
Users can find Workday Adaptive Planning reports in the same way they find other resources in the BI Portal. A couple tips:
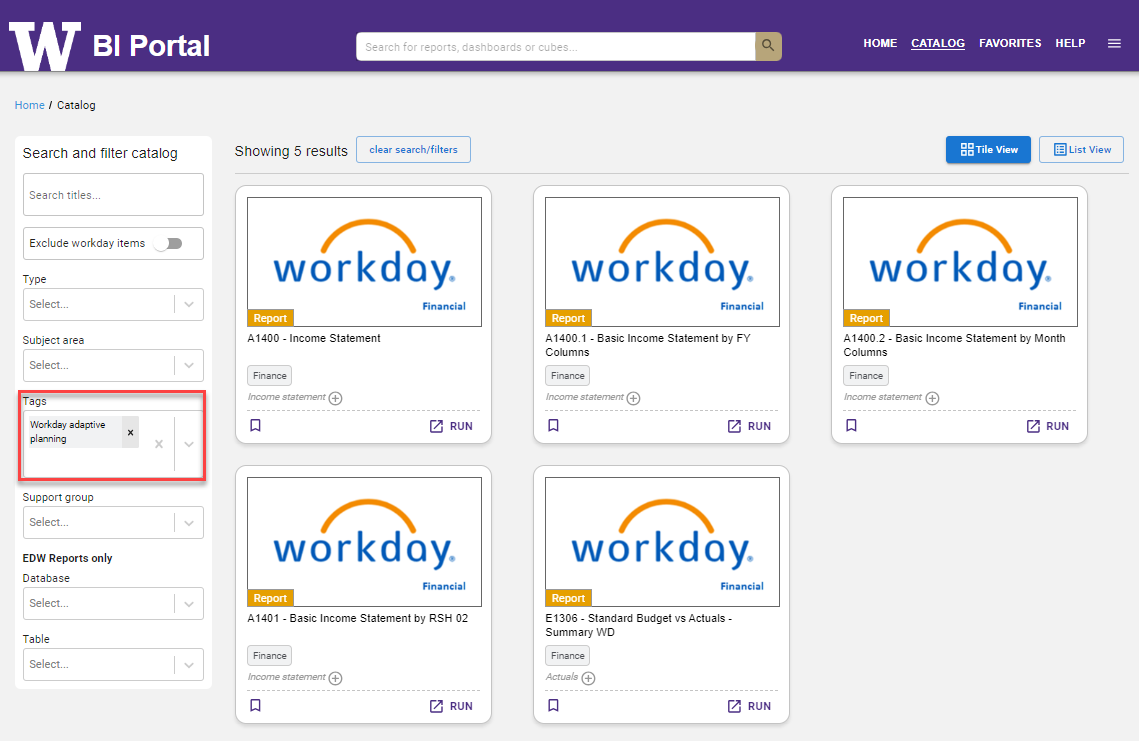
Filter by the new tag – A Workday Adaptive Planning tag is available on the Catalog page to quickly drill-down to applicable reports.
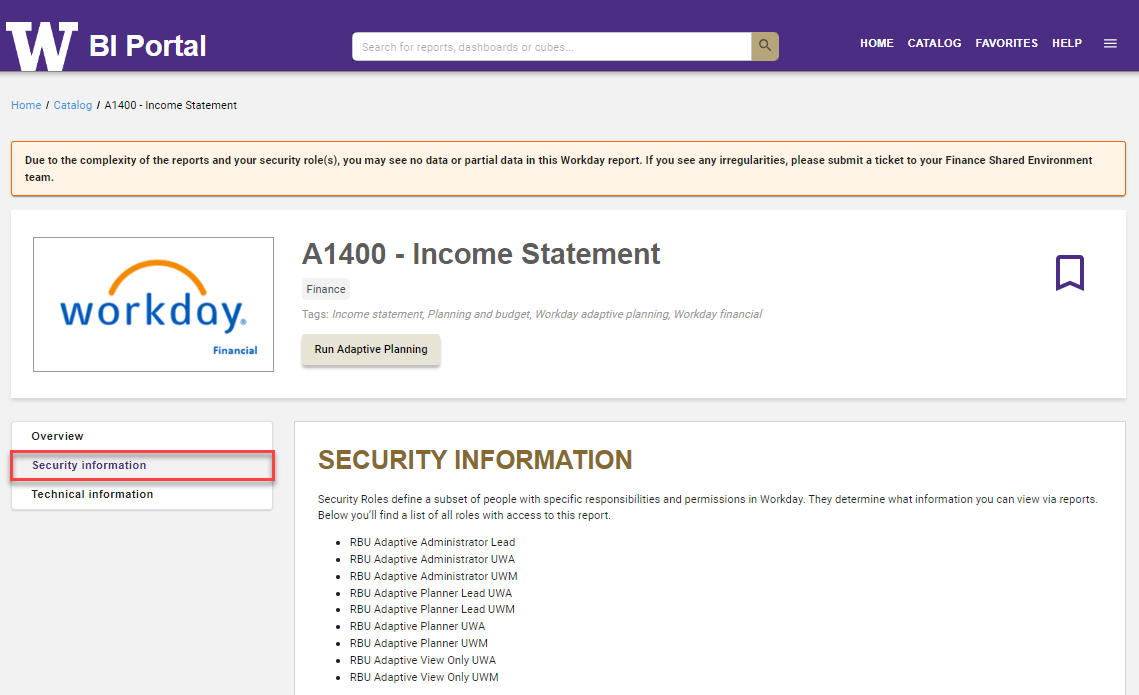
Discover available Workday Adaptive Planning reports and associated security information – In Workday, reports are assigned by security role. The security role not only determines which reports the user can run, but which reports they can discover. In the BI Portal, a user can discover any report in the catalog. While a user’s security role will still determine which reports they can run, this visibility allows users to identify potentially useful reports, check the Security Information tab to determine which roles have access, and then request elevated access, if warranted.
Questions?
Please submit questions as follows to ensure they reach the appropriate team and get a quicker response:
If you have questions that relate to…
Then…
The actual Adaptive Planning reports and associated data…
Thanks to a collaborative effort between UW-IT’s Business Intelligence (BI) and Web Applications teams, along with valuable input from the School of Nursing, the Student Employees Dashboard is now available in the BI Portal!
Turning Ideas into Insights
The Catalyst for Development
The dashboard project began with a request from a department within the School of Nursing, which relied on manual queries of the Enterprise Data Warehouse (EDW) to access student employee data. Although effective, this method required a manual process and technical expertise. The department needed a more efficient, user-friendly solution that could be easily accessed by all staff.
The BI Team saw potential for a solution that could benefit other departments. They set out to design a dashboard that would offer insights into student employee data.
A User-Centric, Yet Scalable Solution
Dashboard development starts with understanding the data—specifically, the data users need and where it comes from. While the initial request focused on data for a single HR organization (the School of Nursing), which could be sourced from the EDW, the team saw value in creating a solution that could scale across the University. However, to achieve this broader application, an additional data source was needed.
The team identified two sources for the necessary data: Workday (HR Hierarchy) and the EDW (student employee detail). The Web Applications team pulled the applicable data from these two sources into Snowflake—a cloud-based data warehousing platform—to create a comprehensive view, which is processed and updated daily. This view serves as the data source for a Tableau extract, which is refreshed daily at 7:00 am.
With the Tableau extract available, the BI Team built a Tableau dashboard, eliminating the need for manual queries, and providing departments across campus with instant, accurate, and up-to-date insights on student employees. Throughout development, the team collaborated closely with the School of Nursing to ensure the dashboard continued to meet their specific needs while also serving a broader audience.
Access
While this dashboard can be used across campus, access is restricted to users with the Administrator/Manager/FiscalTech ASTRA role.
Exploring the Dashboard
Check out the Student Employees dashboard in the BI Portal to explore the tool, including the following features.
Filters
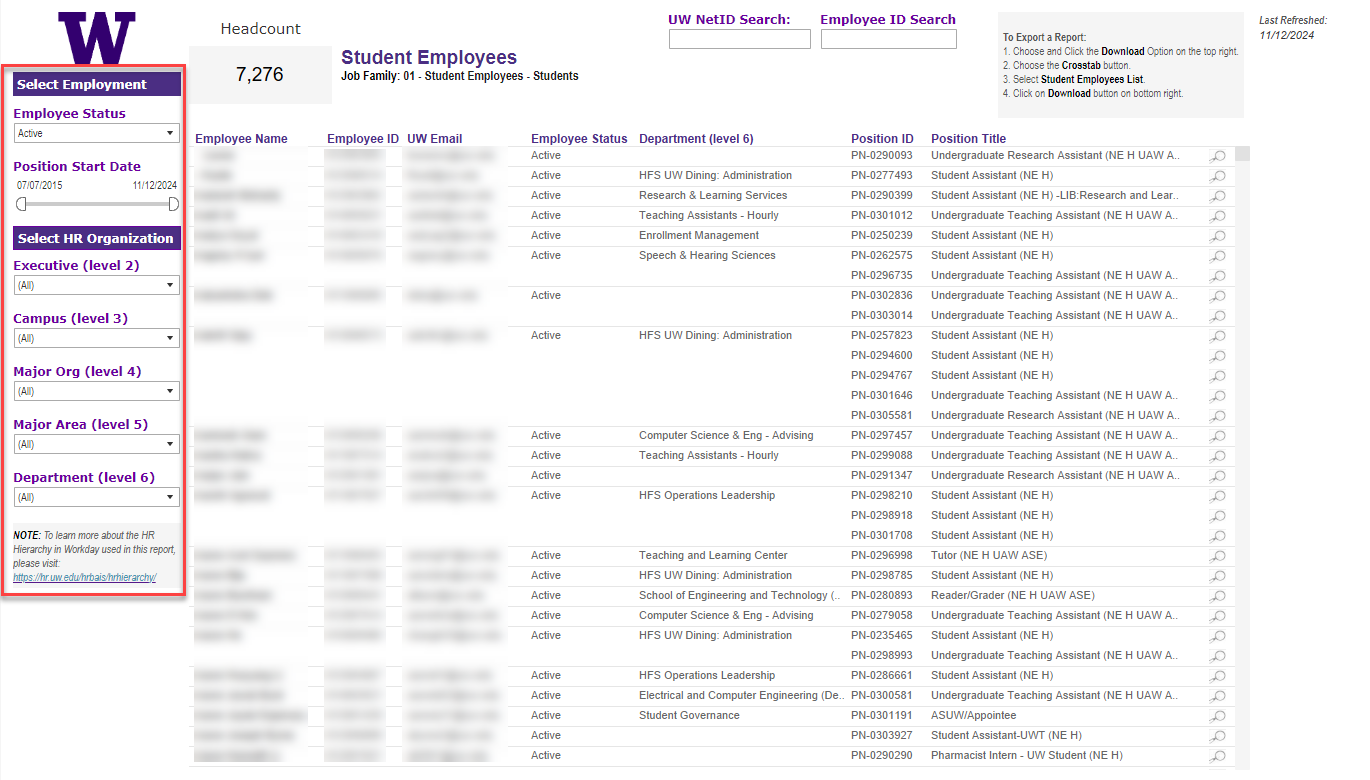
The left panel of the dashboard provides a number of filters, which allow users to narrow results by Employee Status, Position Start Date, and/or various levels of the HR Hierarchy. For more information about these filters, refer to the Filters tab for the dashboard in the BI Portal.
Student Employees Dashboard – Filters
Search
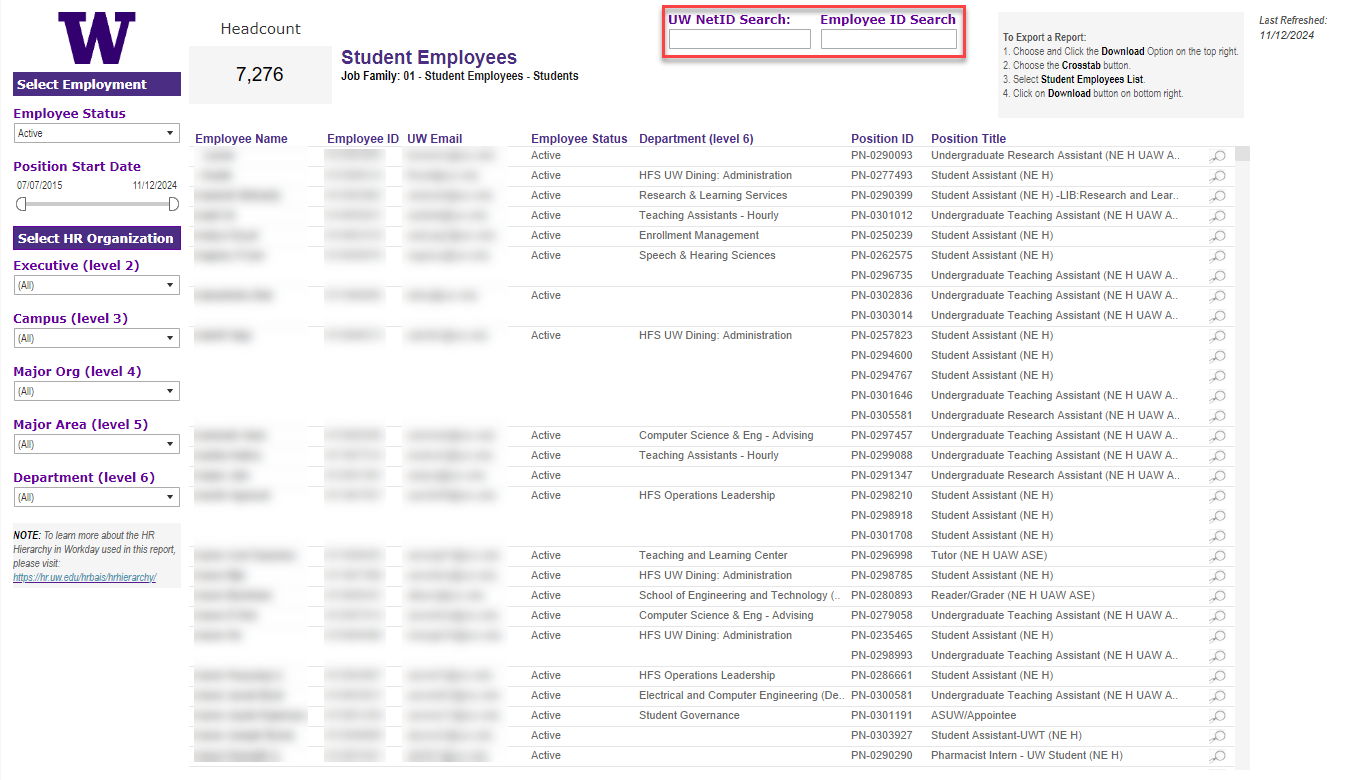
The top of the dashboard provides two search fields, which allow users to search for a specific student by Student Number or UW NetID.
Student Employees Dashboard – Search
Results
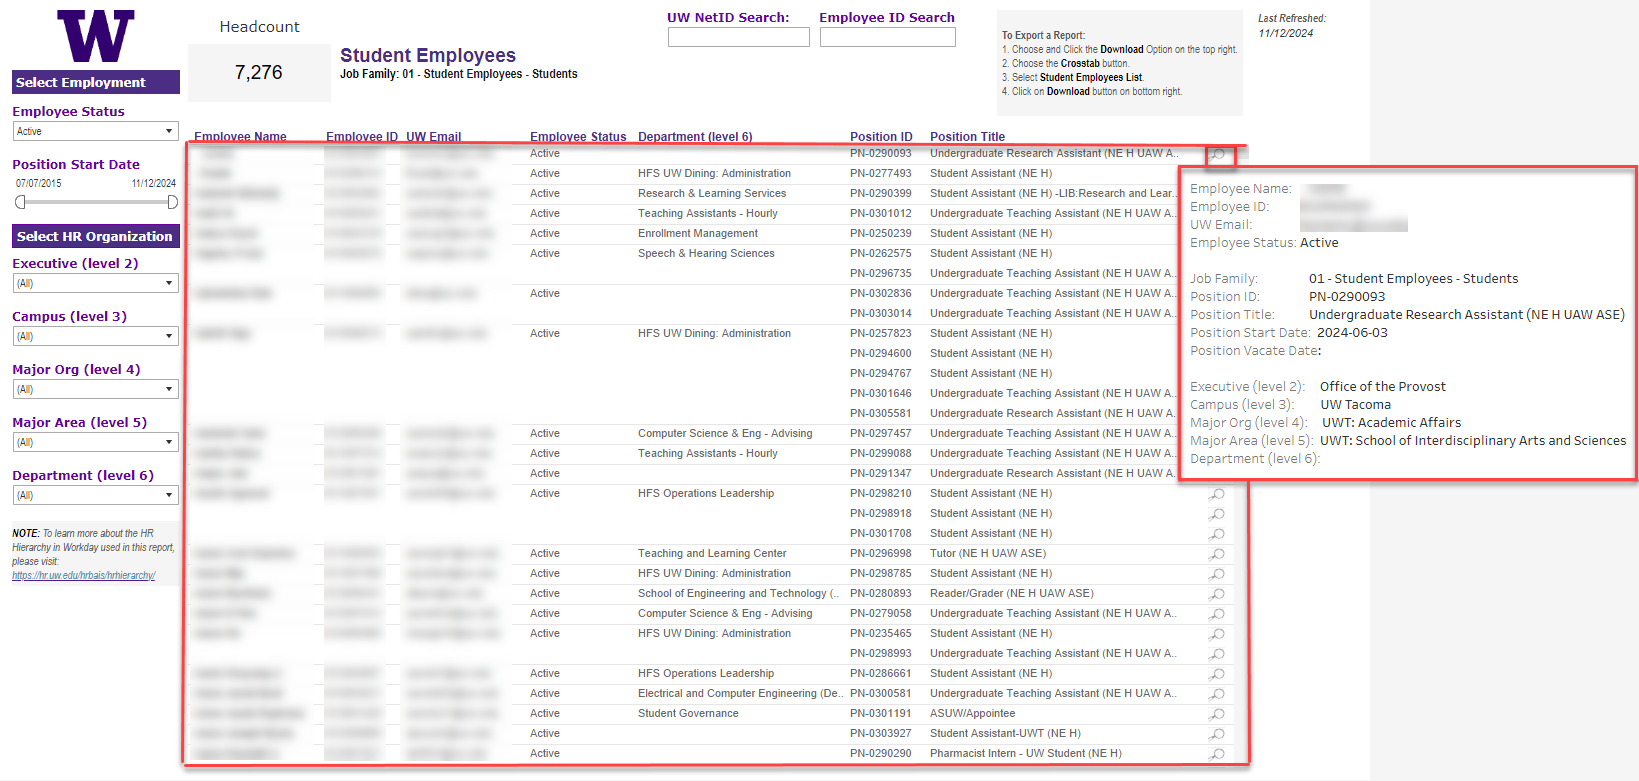
The center of the dashboard displays the results, based on the filter or search specifications. Additionally, each row in the results includes a Magnifying Glass icon, which the user can hover over to display additional detail for a specific student.
Student Employees Dashboard – Results
Questions/Feedback/Ideas?
Do you have a question about this dashboard and/or a request for a new resource in the BI Portal? Please submit a ticket to help@uw.edu with “BI Portal” in the subject line.
The Reporting & Analytics team (R&A) and Finance DATAGroup have released new versions of the UW Finance Cube and UW Balance Sheet Cube for FY 2024 and FY 2025! Thanks to user feedback, the following updates are now available!
You can now connect directly to a Workday journal from the cube with just one click. This feature makes it easy to view detailed journal entries after drilling through to journal line details.
New dimensions (UW Balance Sheet Cube/UW Finance Cube)
You can now sort values for the following dimensions alphabetically by name, in addition to the existing code/name format (for example, AC100001 – AC100001 UWIT | ServiceNow Licenses):
Activity
Appropriation
Assignee
Award
Award Line
Balancing Unit
Cost Center
Customer
Function
Fund
Gift
Grant
Internal Service Provider
Ledger Account
Object Class
Program
Project
Resource
Revenue Category
Spend Category
Sponsor
Supplier
Not seeing what you’re looking for in this release?
There is another release planned for October, so watch your inbox for an announcement! In the meantime, if you have questions or feedback on any of these cubes, please email help@uw.edu with “BI Portal Finance Cube” in the subject line.
The student database (SDB) will go through a reorganization on October 19, 2024 which will cause changes in the Enterprise Data Warehouse database, UWSDBDataStore. These changes to the objects will be available in the UWSDBDataStore on October 21, 2024.
However, data on the new objects will be available as soon as the Data Custodians submit the security role definitions and the SIS team loads the data.
Last Updated – 9.27.24
Columns to be Added
Table
Column
DataType
ISIR_TRANSACTIONS
ISIR_MAX_PELL_IND
char(1)
ISIR_MIN_PELL_IND
char(1)
I_SPO_BIRTH_DT
datetime
I_SPO_SS_NO
int
I_P1_BIRTH_DT
datetime
I_P1_SS_NO
int
I_P2_BIRTH_DT
datetime
I_P2_SS_NO
int
I_STD_FTI_CONS
char(1)
I_SPO_FTI_CONS
char(1)
I_P1_FTI_CONS
char(1)
I_P2_FTI_CONS
char(1)
SF_EVALUATION
CALC_P_FAM_SIZE
tinyint
CALC_S_FAM_SIZE
tinyint
CPS_PELL_CHANGE
char(1)
SF_EVALUATION1
OVRD_EXCLUDE_ASTS
char(1)
OVRD_SINGL_PARENT
char(1)
INAS_SINGL_PARENT
char(1)
SR_ADM_RESULTS
SR_AAR_SSN
int
SR_AAR_SLATE_ID
int
SR_AAR_SPARE_1
int
SR_AAR_SPARE_2
int
SR_AAR_SPARE_3
int
SR_AAR_SPARE_4
char(10)
SR_AAR_SPARE_5
char(10)
SR_AAR_SPARE_6
char(10)
SR_AAR_BOOLEAN_1
bit
SR_AAR_BOOLEAN_2
bit
SR_AAR_BOOLEAN_3
bit
SR_AAR_BOOLEAN_4
bit
SR_AAR_BOOLEAN_5
bit
SR_AAR_BOOLEAN_6
bit
SR_AAR_BOOLEAN_7
bit
SR_AAR_BOOLEAN_8
bit
STUDENT_2
DEIB_STAT
tinyint
DEIB_STAT_DT
datetime
DEIB_EXP_DT
datetime
DEIB_COMMENT
char(75)
DEIB_UPDT_DT
datetime
DEIB_UPDT_ID
char(12)
SYS_TBL_39_CALENDAR
DAY2_REG_DT
datetime
Fields moving from SF_Evaluation to SF_Evaluation1