The user experience and functionality for inviting a user to create an account has been updated with the following changes:
New functionality allowing users to accept or decline invitations sent by the Delegated Administrator to join an account.
If the user declines the invitation, they see the new Declined Invitation page. After this, the user will not be able to re-access the invitation link sent in their email.
When a user accepts the invitation to join an organization, they will be able to proceed to log in with their UW NetID.
Delegated Administrators can send an access code to the user as part of the invitation process.
We’ve successfully navigated our first fiscal year (FY) with Workday Finance! Since its launch on July 1, 2023, our financial analysis tools have expanded significantly and continue to evolve. Now, a new generation of finance cubes is available in the BI Portal: the UW Balance Sheet Cube for FY 2024 and FY 2025, along with a new version of the UW Finance Cube for FY 2025.
Note: If you are working remotely, you must be logged into Husky OnNet (VPN) in order to access some of the links in this article. For more information, refer to Husky OnNet.
What is the UW Balance Sheet Cube?
The UW Balance Sheet Cube provides insights into balance sheet data, with versions available for FY 2024 and FY 2025. It uses a subset of the measures and dimensions available in the UW Finance Cube, but focuses on different data:
Cube
Type of Data
UW Finance Cube
Expenses
Revenues
Beginning balances/net positions
UW Balance Sheet Cube
Assets and liabilities
Deferred inflows and outflows
Ledger account types
Net positions
More generally, a data cube is a powerful analysis tool, which allows users to quickly and easily slice and dice data across multiple dimensions, in a single view. For an introduction to cubes, including their benefits over traditional analysis tools such as reports, refer to the What is a Cube introductory video.
How will the UW Balance Sheet Cube help me?
Comprehensive Balance Sheet Insights: View balance sheet data across multiple dimensions. Whether it’s analyzing assets and liabilities by balancing unit or deferred inflows and outflows by fund, you can gain a holistic view of the balance sheet.
Drill-Down Capabilities: Drill down from summaries to finer levels of information. This feature allows for more granular analysis and better decision-making.
User-Friendly Pivot Tables: Connect to the cube and effortlessly create pivot tables by dropping prepopulated measures and dimensions into place.
Preferred Analysis Tool: Connect to the cube via your preferred analysis tool (for example, Excel, Power BI, or Tableau) for seamless integration.
Accessing FY 2025 data in the UW Balance Sheet and UW Finance Cubes
Both of these cubes provide access to A LOT of data and we’re only one year into using Workday! To preserve performance as the amount of data grows over time, a new data cube will be created for each fiscal year. This allows for faster data retrieval and more efficient analysis, as it optimizes and isolates the data for each period, reducing system load and processing times.
FY 2025 versions are now available for the UW Balance Sheet and UW Finance Cubes!
How do I access these new cubes?
Refer to UW Finance Cube Resources – Workday Data to download the applicable base workbook and get connected to the cubes! The following base workbooks are now available on this page:
UW Balance Sheet Cube FY 2024 (new!)
UW Balance Sheet Cube FY 2025 (new!)
UW Finance Cube FY 2024 (previously available)
UW Finance Cube FY 2025 (new!)
Acknowledgements
These cubes are the result of another fantastic collaboration between UW-IT’s Reporting & Analytics (R&A) team and UW Finance’s DATAGroup. DATAGroup provided subject matter expertise to make sure the new cubes are meaningful, engaged with users to understand gaps and requirements, and shared examples and feedback to support the development team. R&A leveraged the DATAGroup’s input, built cubes to meet user, security, and metadata requirements, tested the cubes, and deployed them to the BI Portal catalog.
Key Contributors:
Danel Phelps, Business Intelligence Engineer, DATAGroup
Dale Murphy, Project Manager, DATAGroup
Dinah Mite Millikin, Director, DATAGroup
Marci Farrell, Business Intelligence Engineer, R&A
Bomani Siwatu, Test Lead, R&A
Nina Velikin, Technology Manager, R&A
Dave Beaulieu, Senior Accounting Analyst, Financial Reporting
Jefferey Babauta, Director of Finances and Reporting, Office of Research
Questions?
Please contact help@uw.edu with “UW Finance Cube” in the subject line.
The University of Washington is committed to fostering a safe and respectful environment for all students and employees. As part of this mission, the Office of Community Standards & Student Conduct (CSSC) offers an essential online training program on the dangers of hazing. Underscoring its critical importance, this training is mandatory for all incoming students and employees.
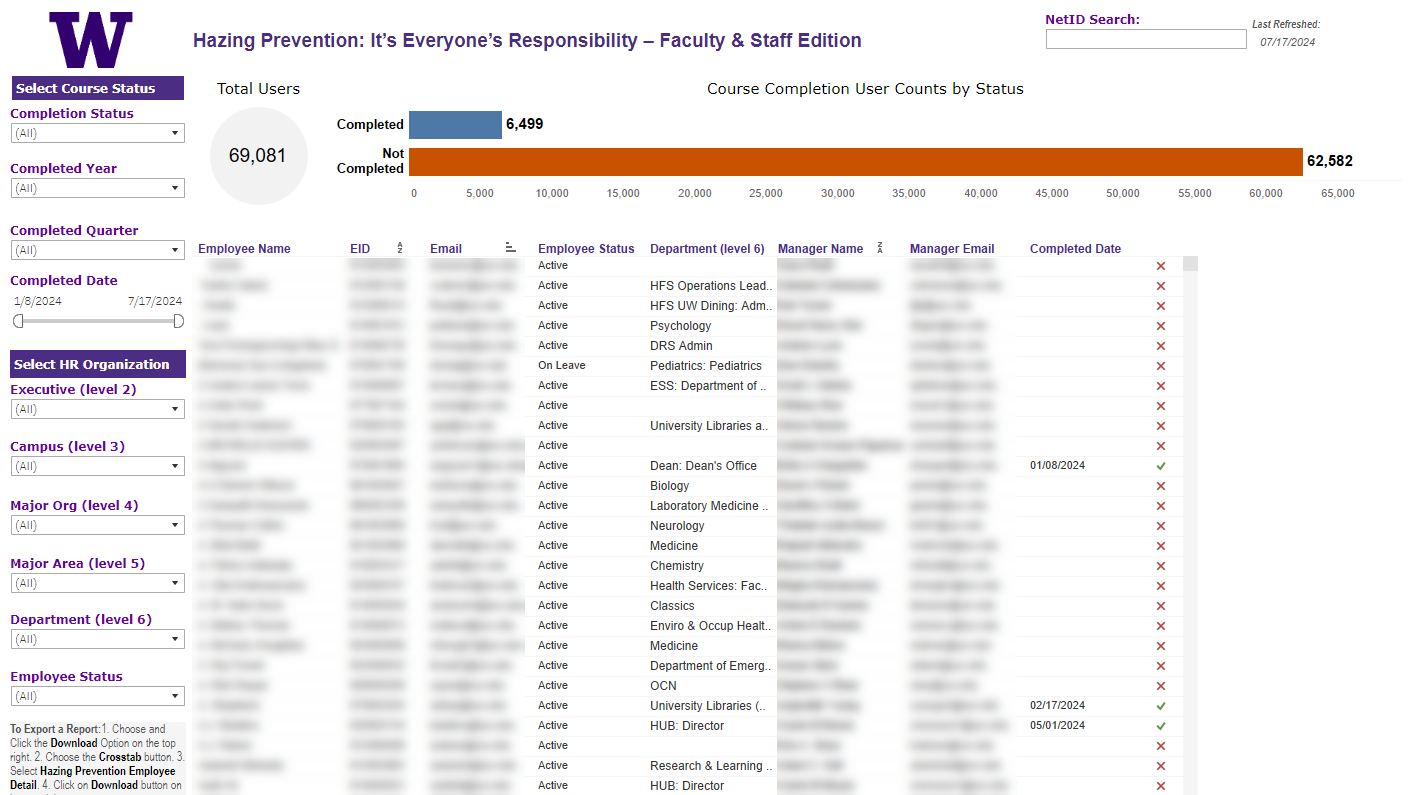
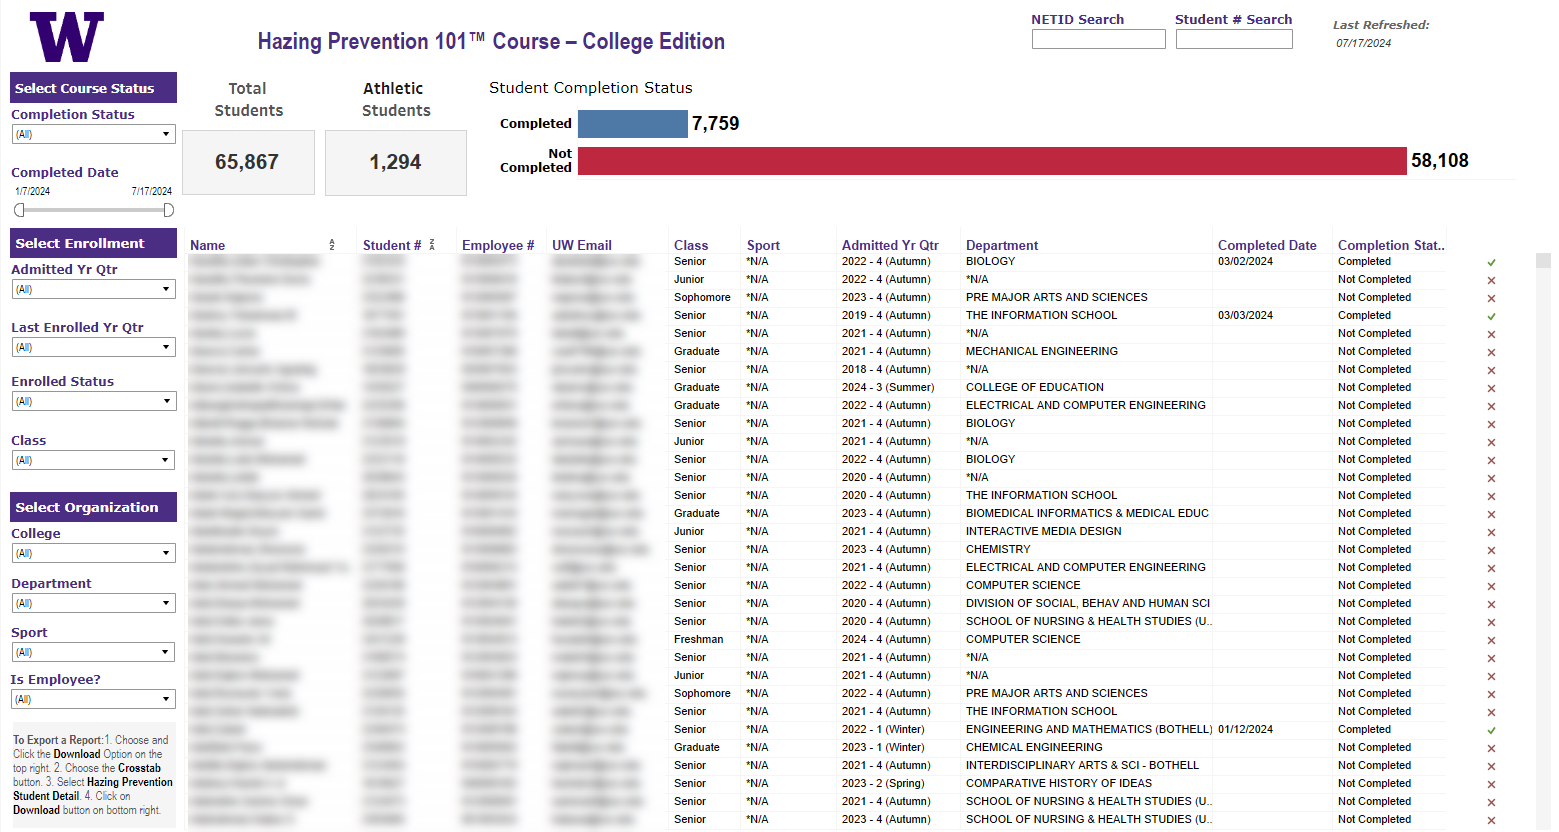
To enhance the effectiveness of this program, UW-IT’s Reporting & Analytics team partnered with CSSC to develop two new dashboards, which are now available in the BI Portal! These dashboards track completion records for hazing prevention training, identify areas for additional outreach, and support compliance with this crucial requirement.
For more information about these courses, refer to:
Creating these dashboards was a team effort! CSSC staff provided the requirements and feedback, while folks in the Reporting & Analytics Web Applications and Business Intelligence (BI) teams pulled the data from various sources and developed and tested the dashboards.
Understanding the Data Pipeline
Typically, BI Portal resources utilize data from the Enterprise Data Warehouse (EDW); however, these dashboards required an additional data source. Because the training is managed by a third-party vendor (AliveTek), completion records had to come from them, while student and employee data had to come from the EDW. This integration is what made the data meaningful and actionable for users.
To combine these data sources, Indra Narayan, a Data Engineer from the Web Applications team pulled data from AliveTek via an API and loaded it into Snowflake, a cloud-based data warehousing platform. In Snowflake, Indra integrated key student and employee data from the EDW and Workday, creating a comprehensive view for Tableau Dashboards.
With the data ready, Grzegorz (Greg) Grabowski, a Sr. BI Developer from the BI team built the dashboard in Tableau and collaborated with CSSC to ensure it included all necessary elements to meet user needs. Finally, Tracy Fisher, a Software Tester also from the BI team, verified the functionality, accuracy, and stability of the dashboards before they were deployed to production.
About the New Dashboards
Hazing Prevention Employee Course Completion
The Hazing Prevention Employee Course Completion dashboard offers a comprehensive summary of employee participation in the course, highlighting the total number of employees. You can drill down into specific data using filters like completion status, completed date, HR Org status, and employee status. There’s even a search function for specific NetIDs. You can also hover over the checkmark (✔) or crossmark (X) icons in the results to display a tooltip with additional context, such as manager information and HR organization.
The Hazing Prevention Student Course Completion dashboard offers a comprehensive summary of student participation in the course, highlighting the total number of students and those involved in UW athletic programs. You can drill down into specific data using filters like completion status, enrollment information, college, department, sport, and more. There’s even a search function for specific NetIDs or student numbers. You can also hover over the checkmark (✔) or crossmark (X) icons in the results to display a tooltip with additional context, such as manager information and student academic organizations.
The dashboard also identifies which students are also employees, providing key information to support follow-ups and identify trends.
The Husky Card is the official ID for the UW community, granting access to services like campus libraries, buildings, transportation, and entertainment. Husky Card Services (HCS), part of UW Housing & Food Services, is responsible for managing and issuing these cards.
To provide comprehensive insights into Husky Card production and distribution data, UW-IT’s Reporting & Analytics and Administrative Services teams partnered with HCS to develop a custom dashboard. This dashboard is hosted on UW-IT’s Tableau server with access managed via a UW Group. Although not widely available, this dashboard shows a powerful data solution that emerged from a collaborative effort.
Collaborating to Meet Requirements
The initiative began with Jacob Lipman, a Senior Applications System Engineer from UW-IT’s Administrative Systems, Custom Solutions team, who recognized the need for a dashboard while working with HCS on another project. The HCS team was manually extracting, cleaning, and formatting data on a monthly basis for leadership reporting—a dashboard could definitely streamline this process!
From there Grzegorz (Greg) Grabowski, a Senior Business Intelligence Developer from the UW-IT’s Reporting & Analytics team joined the effort, collaborating with Administrative Systems to refine a query that extracts data from the IDCard and Student databases. Together they worked on the dashboard prototypes—reviewing and revising them based on user feedback.
About the Dashboard
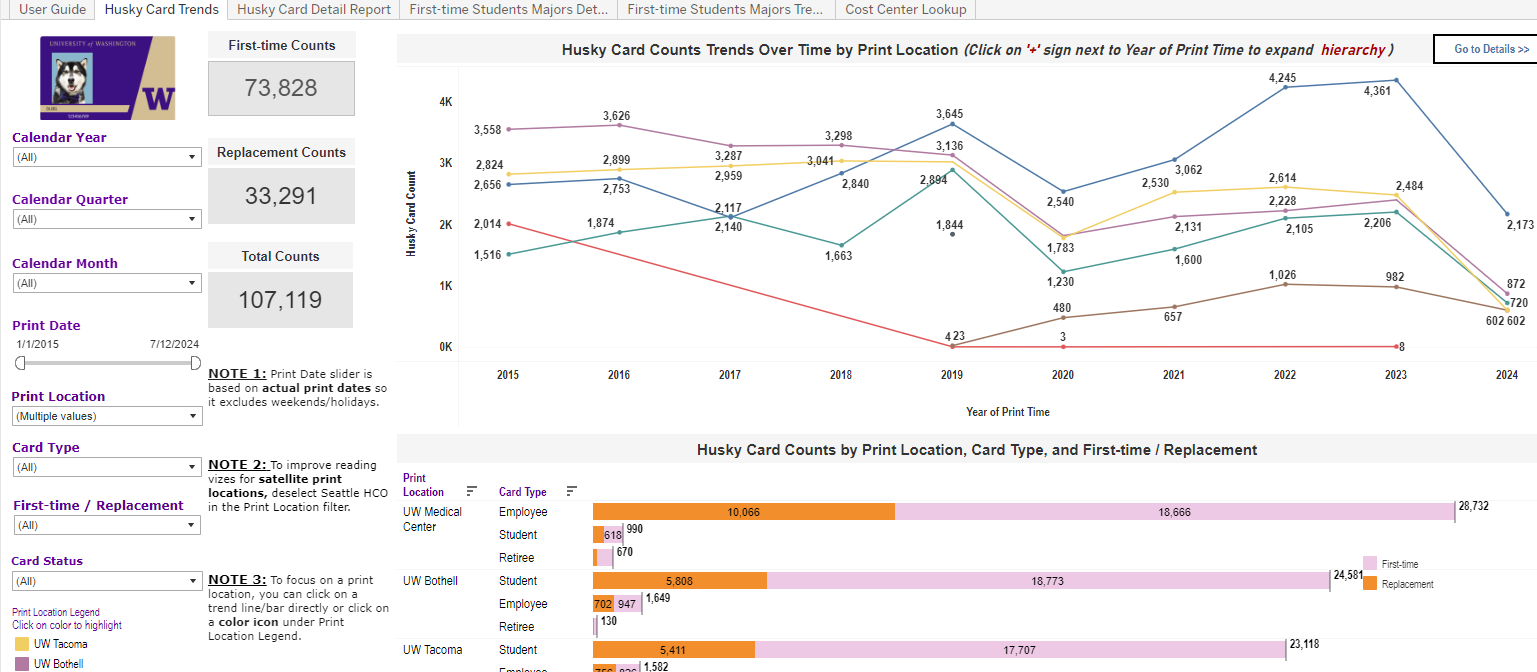
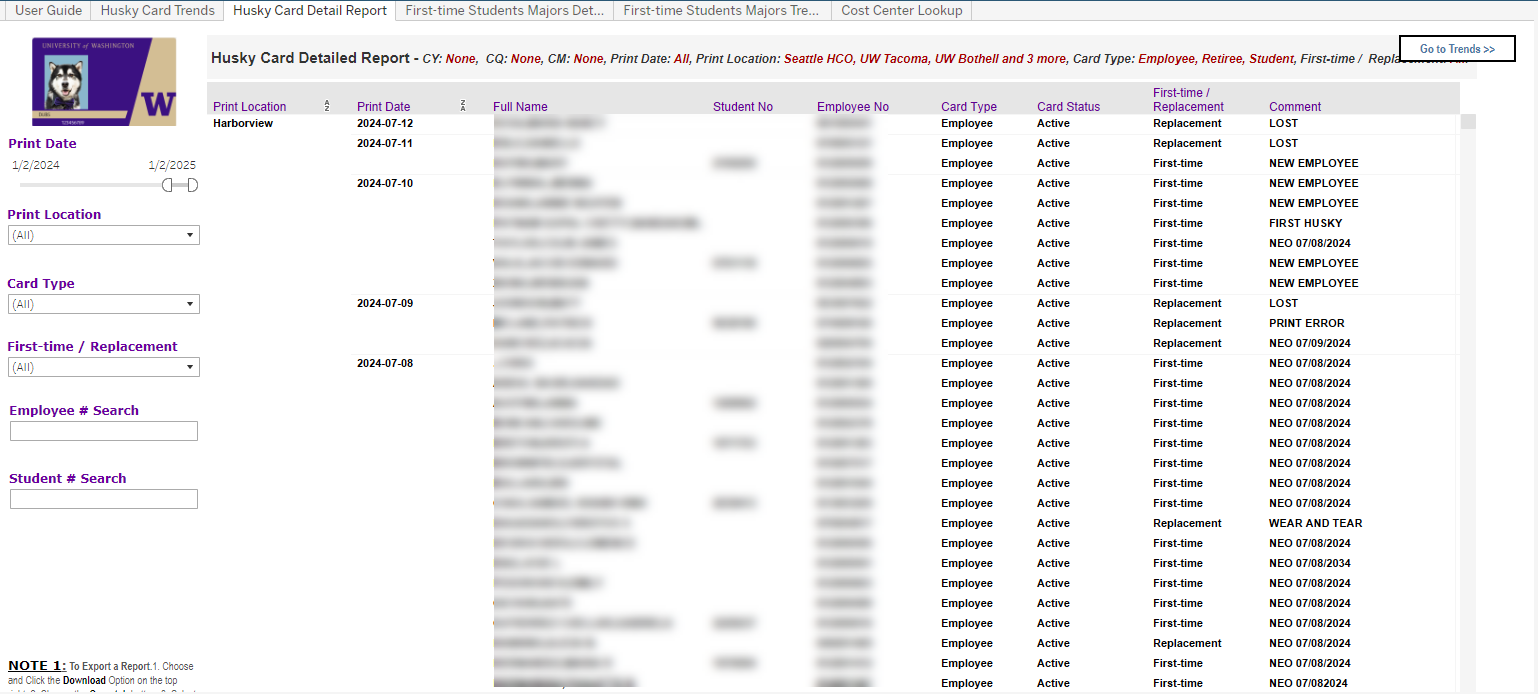
The Husky Card Dashboard answers key business questions by providing the following:
Number of Husky Cards printed, by type (Student, Employee, Retired) and ID office, during a given timeframe.
Peak production times for each ID office, showing volume trends over time (day, week, month, year).
List of individuals issued a Husky Card during a given timeframe, with filterable details.
Number of first-time Husky Cards issued by type during a given timeframe.
Number of replacement Husky Cards issued, filterable by replacement reason (lost, stolen, damaged, etc.) during a given timeframe.
Number and names of fee-based program students issued their first-time student Husky Card during a given timeframe.
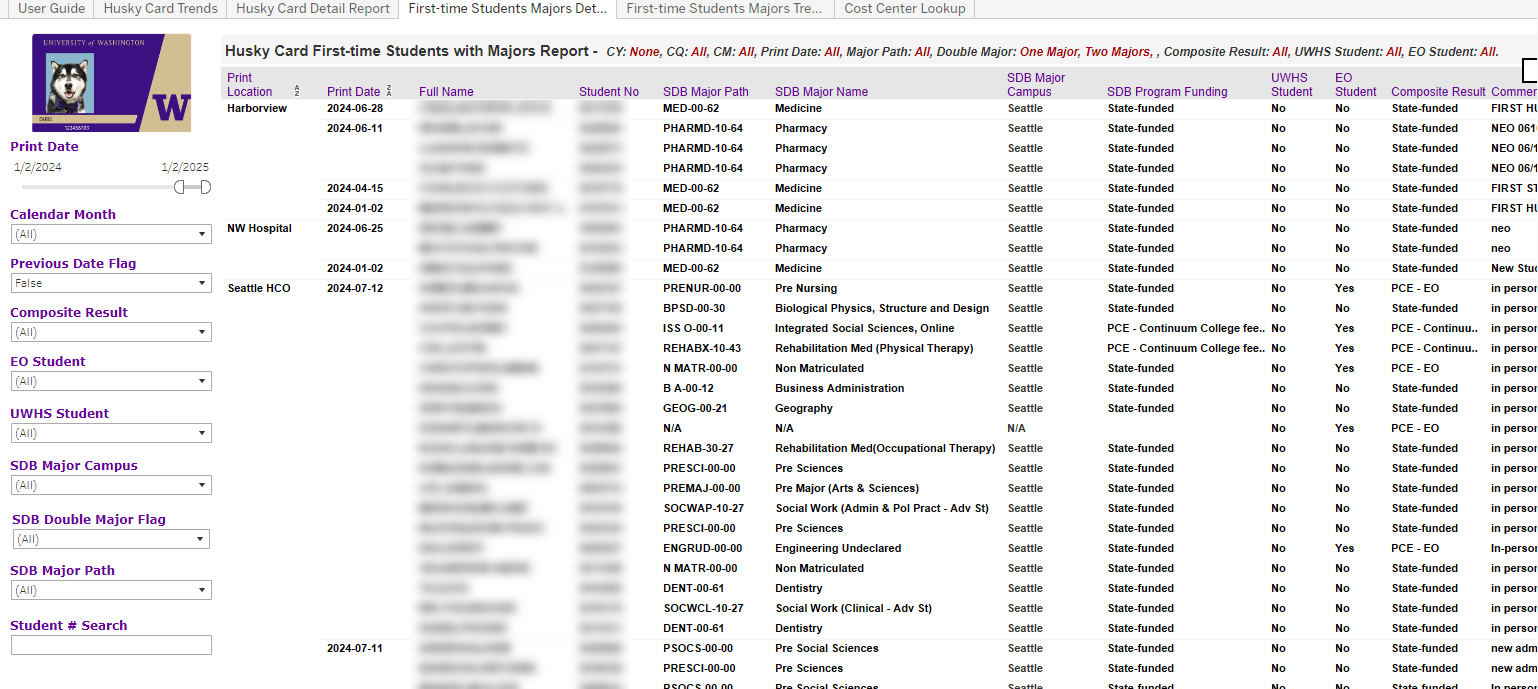
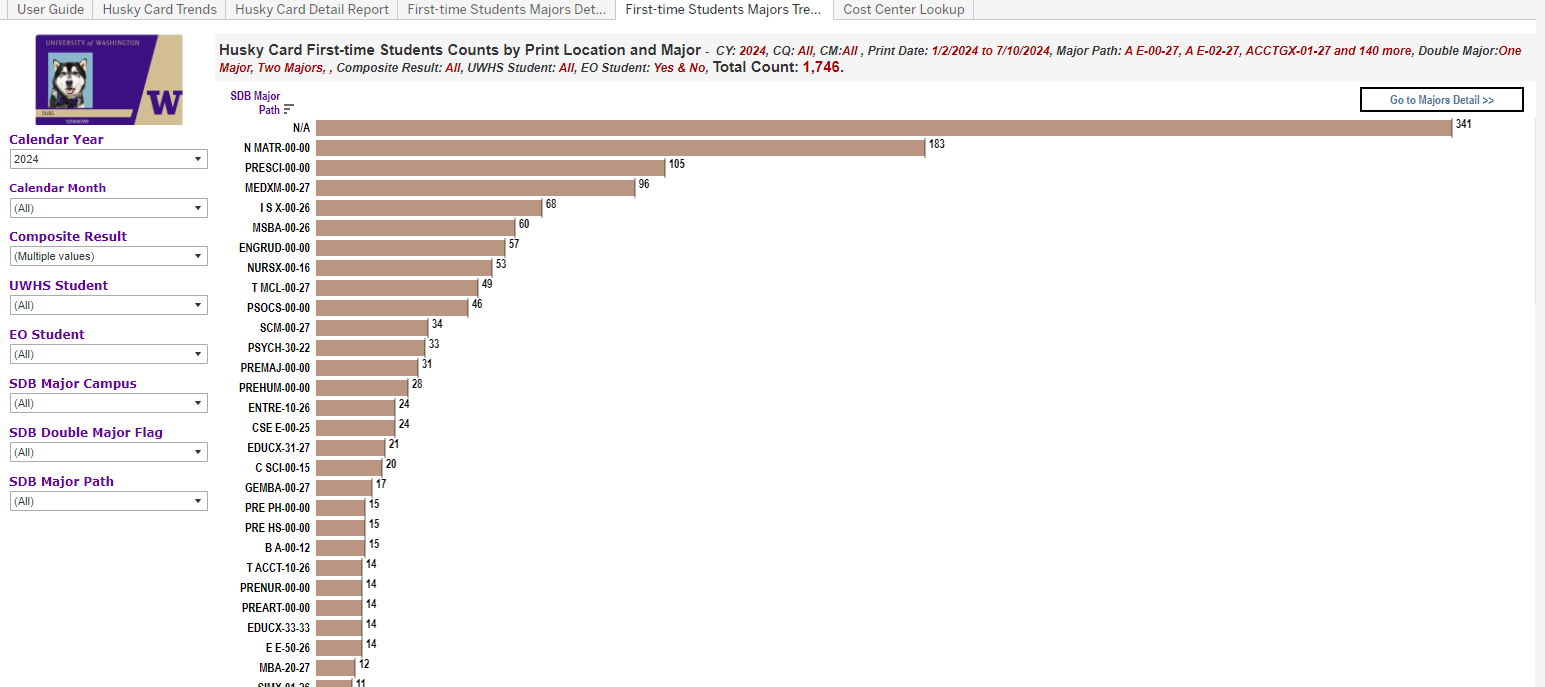
The dashboard presents Husky Card data in a number of different views, which were developed based on feedback from the user.
Husky Card Trends View Husky Card Detail Report View First-Time Students with Majors Detail View First-Time Student Count by Print Location and Major View
Access Information
This dashboard is only available to Husky Card Services.
Questions?
If you have questions about this dashboard or would like to inquire about a similar solution for your department, please contact help@uw.edu with “BI Portal Dashboards” in the subject line.
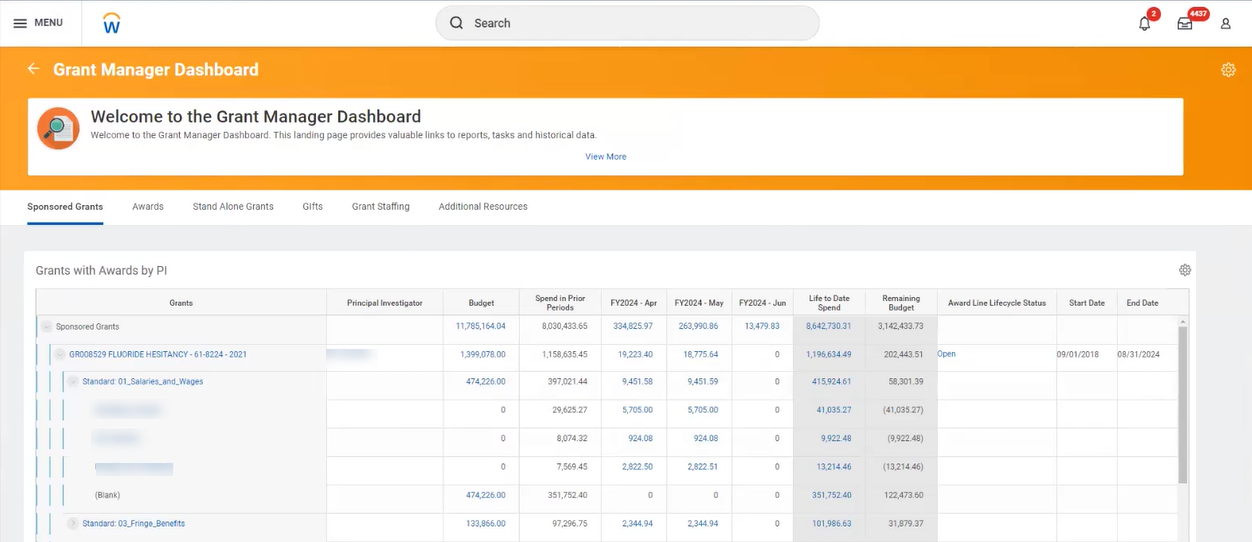
The Grant Manager Dashboard displays grant data, which is tailored to the Grant Manager logged into Workday. This gives Grant Managers a central place to find grant-related content that is specific to them.
Similar to the Principal Investigator Dashboard, this dashboard splits data across six tabs—Sponsored Grants, Awards, Stand Alone Grants, Gifts, Grant Staffing, and Additional Resources.
For more information, including instructions on how to use the tool, refer to the Grant Manager Dashboard wiki page.
Note: If working remote, you must be logged into Husky OnNet (VPN) to access our Wiki site. For more information, refer to Husky OnNet.
Example of the Grant Manager Dashboard – Sponsored Grants Tab
Questions?
Please contact datagrp@uw.edu to initiate a ticket with the Finance DATAGroup.
As of 7/1/24, the BI Portal catalog will include Workday Dashboards and Workday Worksheets!
This enhancement:
Aligns with the broader reporting strategy for UW Academy, which is to provide users with a one-stop-shop for all reporting needs, including available Workday resources.
Allows users to discover additional Workday resources in the catalog. While a user’s security role limits which resources they can access in Workday, the BI Portal allows users to discover all available resources and view security information regardless of role, which they can use to request elevated access, if needed.
About the New Workday Resources
Workday Dashboards
Workday Dashboards consolidate reports, tasks, and external information in one place. They’re customizable for specific roles (like the Financial Desktop or HCM Workspace) and support embedded visualizations. Access is controlled by Workday’s security model, so while a user can search for a Dashboard in Workday, it will only display if they have the correct access.
Workday Worksheets
Workday Worksheets provide a spreadsheet component for Workday data, allowing users to:
Output reports directly to workbooks.
Share worksheets with users who don’t have access to the original reports, enhancing team collaboration.
Link worksheets to reports as Live Data, allowing users to set notes and formulas with data refresh capabilities.
Create and share templates with specific users or groups, including linked reports, manually entered data, and summaries.
Worksheets are accessible in Workday Drive for users with access to Drive. Shared Workbooks can be accessed via email links for users without Drive access.
Access to Workday Drive
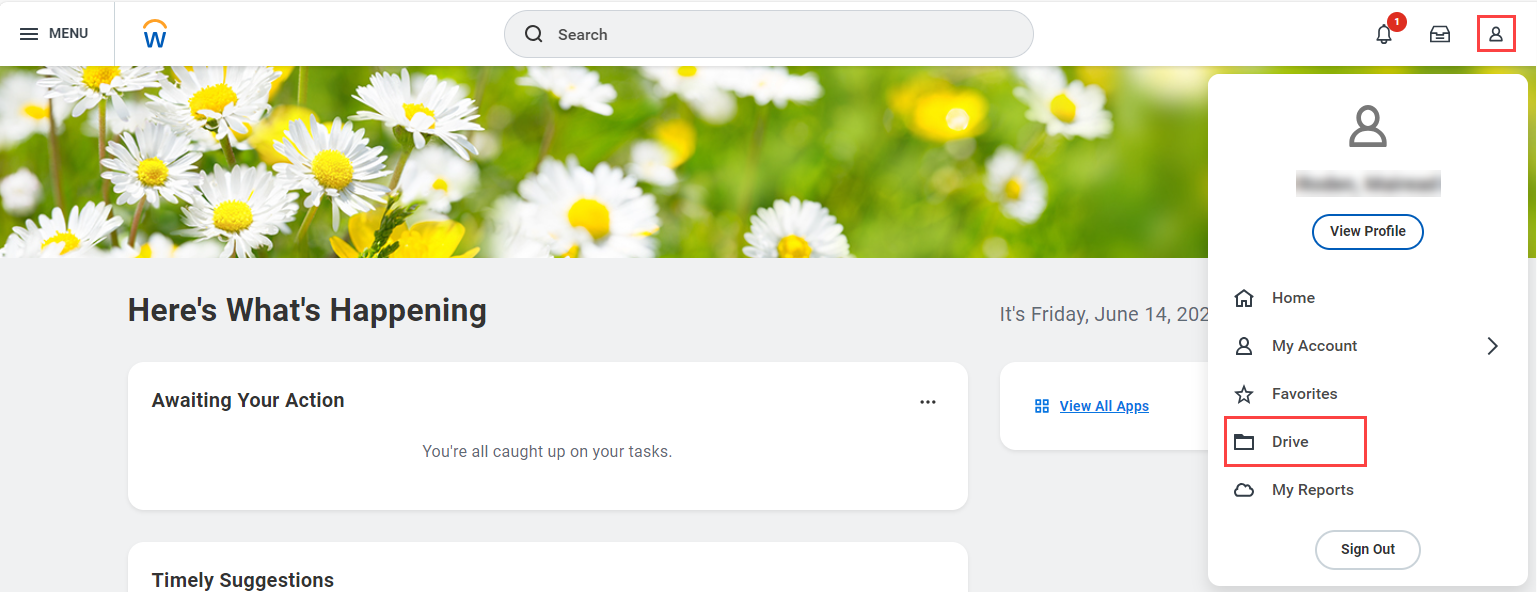
In order to access Workday Worksheets within Workday, a user must have access to Workday Drive. A user can access a Worksheet via Workday Drive or a direct link.
Note: If you need access to Drive, but don’t currently have access, follow the security request process for your unit.
Click the Profile icon in the upper right corner. If Drive displays on the popup, you have access. An example of the Profile and Drive icons in Workday
Click the Run Worksheet link and follow the prompts to login to Workday. If the worksheet displays, you have access.
Finding Workday Dashboards and Worksheets in the BI Portal
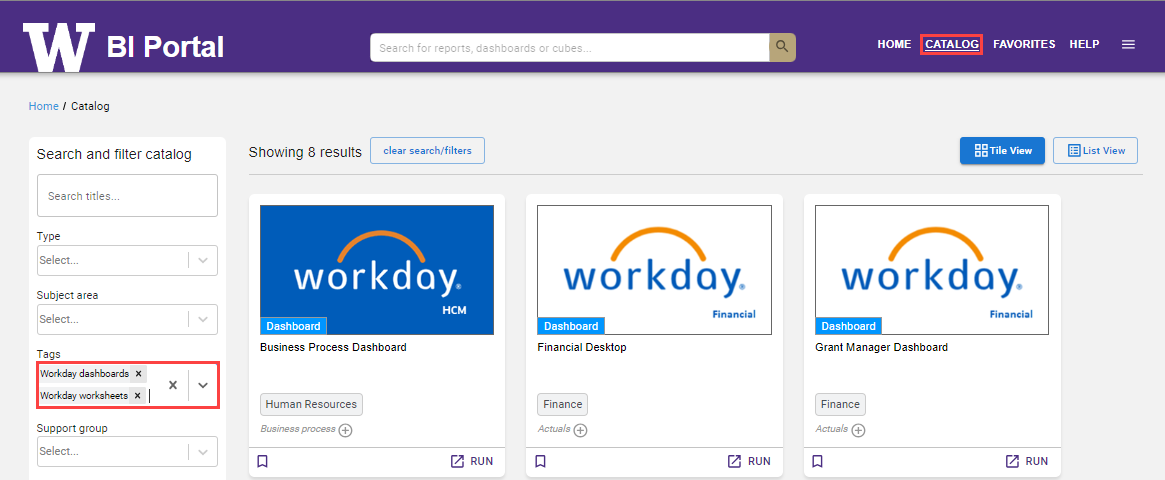
Users can find Workday Dashboards and Worksheets the same way they find other resources in the BI Portal – filters! Specifically, users can filter by the new Workday dashboards and Workday worksheets tags on the Catalog page.
An example of the BI Portal Catalog page filtered by Workday worksheets and dashboards
Questions?
Please submit questions as follows to ensure they reach the appropriate team and get a quicker response.
If you have questions that relate to…
Then…
The actual Worksheet or Dashboard in Workday, the associated data, or access…
The Reporting & Analytics team (R&A) and Finance DATAGroup are pleased to announce two new additions to the BI Portal report catalog. These new finance reports, which leverage Workday data, were inspired by the popular legacy reports “Paid FTE by Funding Source” and “Salary and Wage Detail”.
Workday Paid FTE by Fund Resource Group or Resource
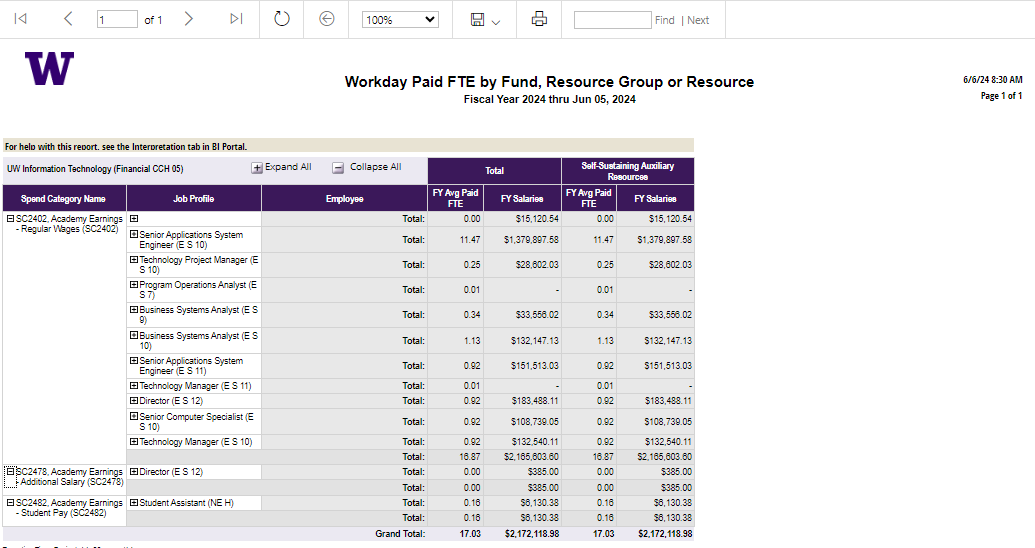
This report breaks down employees paid from a selected Cost Center(s) by employee type or spend category, including salary expense transfers. It outlines the number of Full-Time Equivalent (FTE) employees paid, their total salaries, average monthly Paid FTE and corresponding salary amounts for applicable Funds, Resource Groups, or Resources.
This report is similar to the Legacy Paid FTE by Funding Source report; however, while the legacy report uses Financial Accounting System (FAS) data, this new report uses Workday data.
Example of the Workday Paid FTE by Fund Resource Group or Resource Report
Workday Salary and Wage Expense Detail
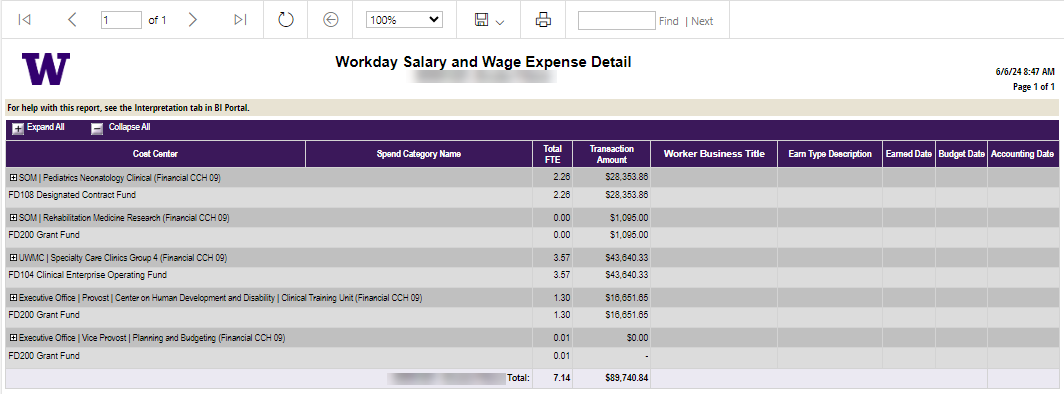
This report details an employee’s pay for a selected reporting period, regardless of Cost Center or funding source, and includes salary expense transfers. It is similar to the Legacy Salary and Wage Detail report; however, while the legacy report uses Financial Accounting System (FAS) data, this new report uses Workday data.
Example of the Workday Salary and Wage Expense Detail Report
Note: This report can be accessed directly from the BI Portal or as a drill through from the Workday Paid FTE by Fund Resource Group or Resource report.
Questions?
Please contact help@uw.edu with “BI Portal” in the subject line.
Knowledge Navigator is a web-based application that allows UW data users to explore key concepts from subject areas including Academic, Finance, Human Resources, and Research. The tool also visually demonstrates how key concepts are linked to data objects like reports and tables.
Content for Knowledge Navigator is developed by business and/or technical subject matter experts and then vetted by data custodians before becoming available in the tool. While users could always provide feedback on this content by submitting a ticket to the Help Desk, there are now two new features that make it easier for users to engage with specific content: Feedback and Expert Advice!
Using the New Features
You can now provide general feedback or expert advice on any detail page in Knowledge Navigator.
Feedback
This feature allows any user to provide feedback on any detail page in Knowledge Navigator. This feedback can include anything from requesting additional detail or clarity on a particular term to identifying gaps or errors.
To submit feedback:
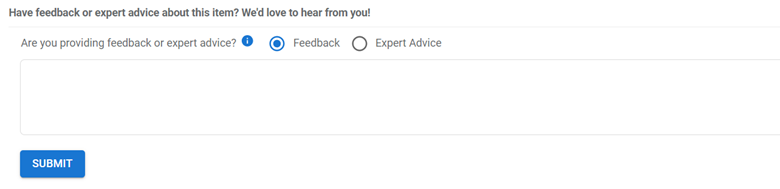
Scroll to the form at the bottom of any detail page in Knowledge Navigator. Example of the Feedback Form
Select Feedback.
Enter your comments.
Click Submit. Your feedback will be submitted to Knowledge Navigator’s Metadata Manager for review and follow up.
Expert Advice
This feature allows users with expertise in Enterprise Data Warehouse (EDW) business concepts, databases, and/or reporting and visualization development, to share their knowledge on a specific page in Knowledge Navigator.
To submit expert advice:
Scroll to the form at the bottom of any detail page in Knowledge Navigator. Example of the Expert Advice Form
Select Expert Advice.
Indicate whether you want your name and UW NetID posted with this advice in Knowledge Navigator.
Enter your comments.
Click Submit. Your feedback will be submitted to Knowledge Navigator’s Metadata Manager for processing. Once processing is complete, your advice will display with the details on the page.
Questions?
Email help@uw.edu with “Knowledge Navigator” in the subject line.
DocuSign recently announced changes and enhancements that will gradually be rolled out to Production in May 2024. All changes and enhancements are available in the Sandbox environment.
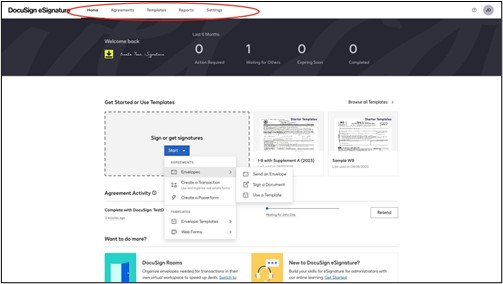
Changes to Global Header Tabs
Renaming of Manage to Agreements
Removal of the Transactions and Forms tabs
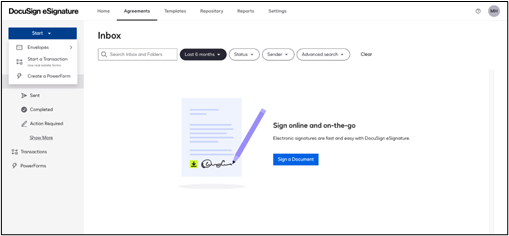
New Transactions can be started from the home page or found under the Agreements tab.
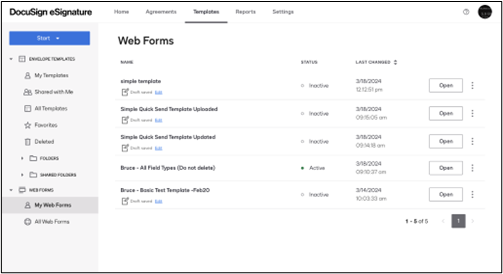
Forms has been renamed to Web Forms and can be found under the Templates tab.
View of home page with updated global header tabs. Transactions can now be started from the home page.
Transactions can also be started under the Agreements tab
Forms (now Web Forms) can be found under the Templates tab
General user interface refresh
Most of the DocuSign interface has a slightly updated look and feel. Included in this refresh is a change of the envelopes lists, templates lists, and web forms lists to be paginated instead of an infinite scroll pattern.
New Functionality — Web Forms
DocuSign now provides Web Forms. This functionality enables users to transform a template into a responsive form for your recipients to complete and sign. As the web form builder, the user is not the sender but can reassign the sender role to another person or authorize yourself.
Additionally, users who have the ability to create web forms will be able to copy an existing web form configuration. Once created, the new web form can be modified independently of the original form.
More information on how to use web forms can be found in DocuSign Support.
New Support Pop-ups
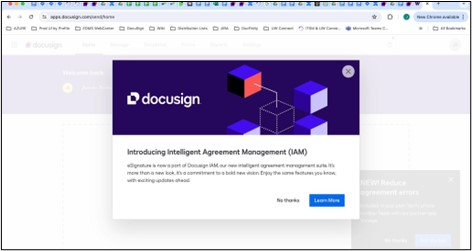
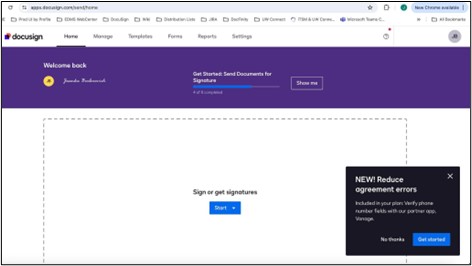
The DocuSign user experience now includes pop-ups for new DocuSign services, e.g.Intelligent Agreement Management, that are not available in our environment.
Additionally, some new instructional pop-ups will lead a user through a process that doesn’t correspond to the access configurations in the UW account. We recommend dismissing irrelevant pop-ups for the time being. Our team will address this with the vendor.
Thank you for using eSignatures. Please don’t hesitate to contact us with any questions.
Exciting news! The Reporting & Analytics team (R&A) and Finance DATAGroup have released the new UW Finance Cube! This represents a major advancement in connecting users to Workday data, providing greater flexibility over traditional Workday reports.
As of 4/23/24, this resource is now available to authorized users through the BI Portal.
Note: You must be logged into Husky OnNet (VPN) in order to access the links in this article. For more information, refer to Husky OnNet.
What is UW Finance Cube FY 2024?
The UW Finance Cube offers a comprehensive view of UW Finances for Fiscal Year 2024, including revenue, expenses, and beginning balances. It also allows users to analyze transactions at various levels using dimensions such as Ledger Account, Cost Center, Fund, Function, and many more!
More generally, a data cube is a powerful analysis tool, which allows users to quickly and easily slice and dice data across multiple dimensions, in a single view. For an introduction to cubes, including their benefits over traditional analysis tools such as reports, refer to the What is a Cube introductory video.
How will UW Finance Cube FY 2024 help me?
Comprehensive Financial Insights: View financial data across multiple dimensions. Whether it’s analyzing research award expenditures and gift revenues or tracking procurement expenses, you can gain a holistic view of your financial landscape.
Drill-Down Capabilities: Drill down from summaries to finer levels of information. This feature allows for more granular analysis and better decision-making.
User-Friendly Pivot Tables: Connect to the cube and effortlessly create pivot tables by dropping prepopulated measures and dimensions into place.
Preferred Analysis Tool: Connect to the cube via your preferred analysis tool (for example, Excel, Power BI, or Tableau) for seamless integration.
How reliable is the data?
Reliable! The data source for the cube is Workday Finance, so as long as the data in Workday is accurate, the data in the cube is accurate.
Additionally, while this is the first public-facing release, this is technically Release 3 (R3) for the cube. Prior releases allowed our development team to learn about Workday production data, design a scalable solution, capture applicable dimensions and measures, and conduct User Acceptance Testing (UAT) with approximately 15 users across campus. UAT ensured the cube would meet user needs and helped us identify some additional dimensions to include in this release.