We are currently implementing report formatting changes across all reports in the BI Portal. This story summarizes those changes and shares some important updates.
1. What Is Changing?
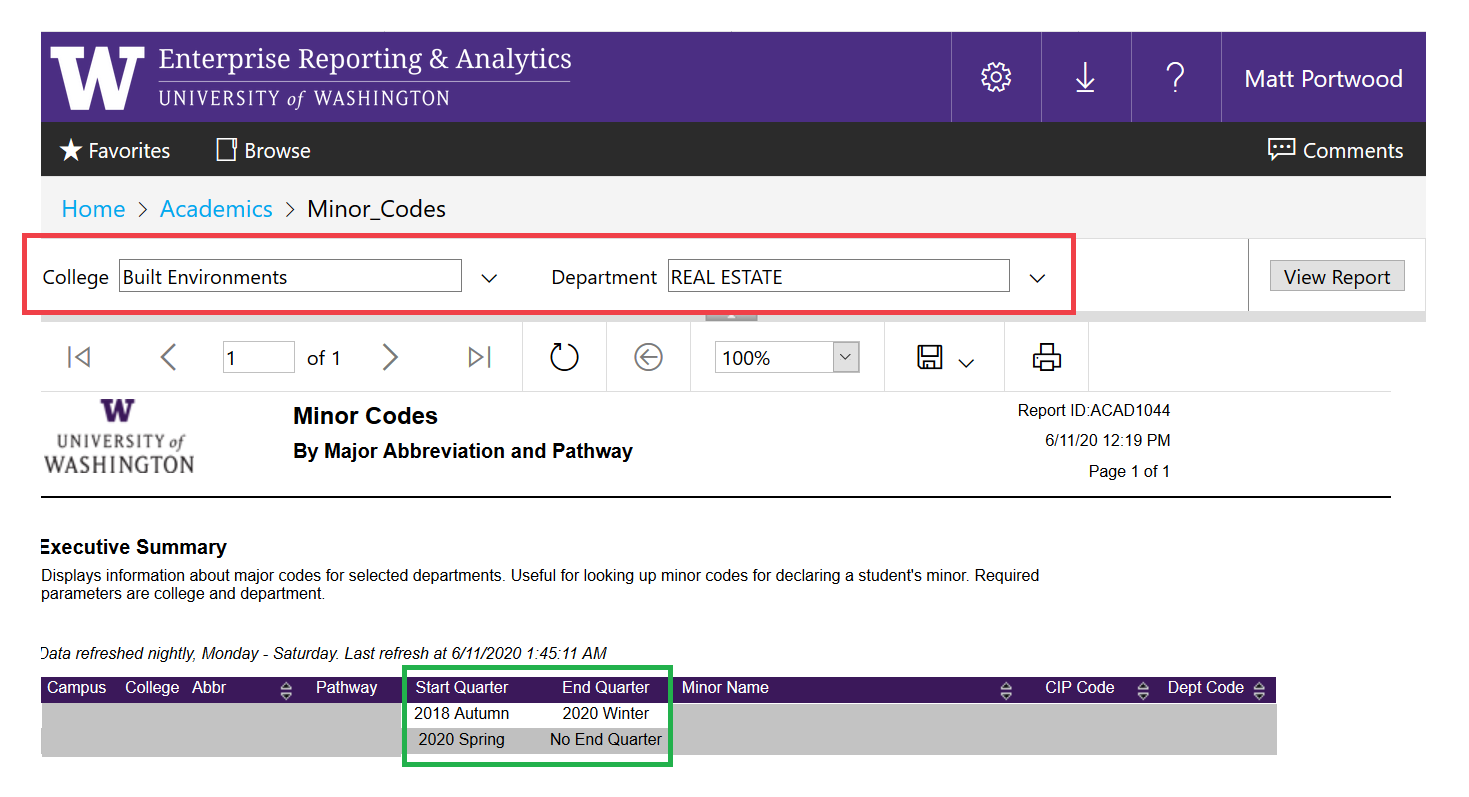
We are updating all of our existing reports to align with a new, clean, consistent, and UW-branded format. See for yourself:
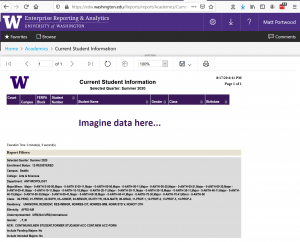
This new report format has many benefits:
- Consistency: A consistent look and feel that aligns with UW branding across all reports.
- Modern: A clean, updated, and modern interface. There are now fewer extra elements clogging up your browser.
- Simplified: Fewer elements means it is easier for us to maintain. This means we can spend more time helping you, and less time fixing formatting bugs.
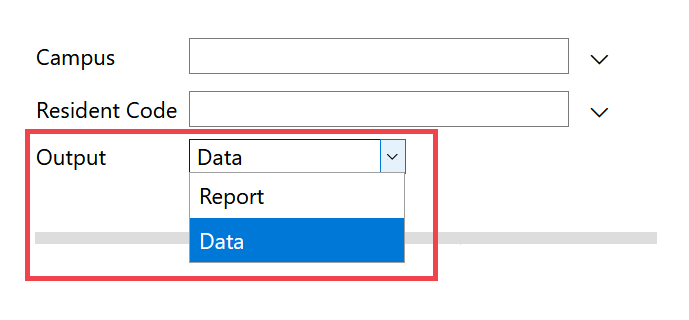
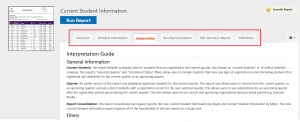
2. Academic Reports: We are removing the report/data filter
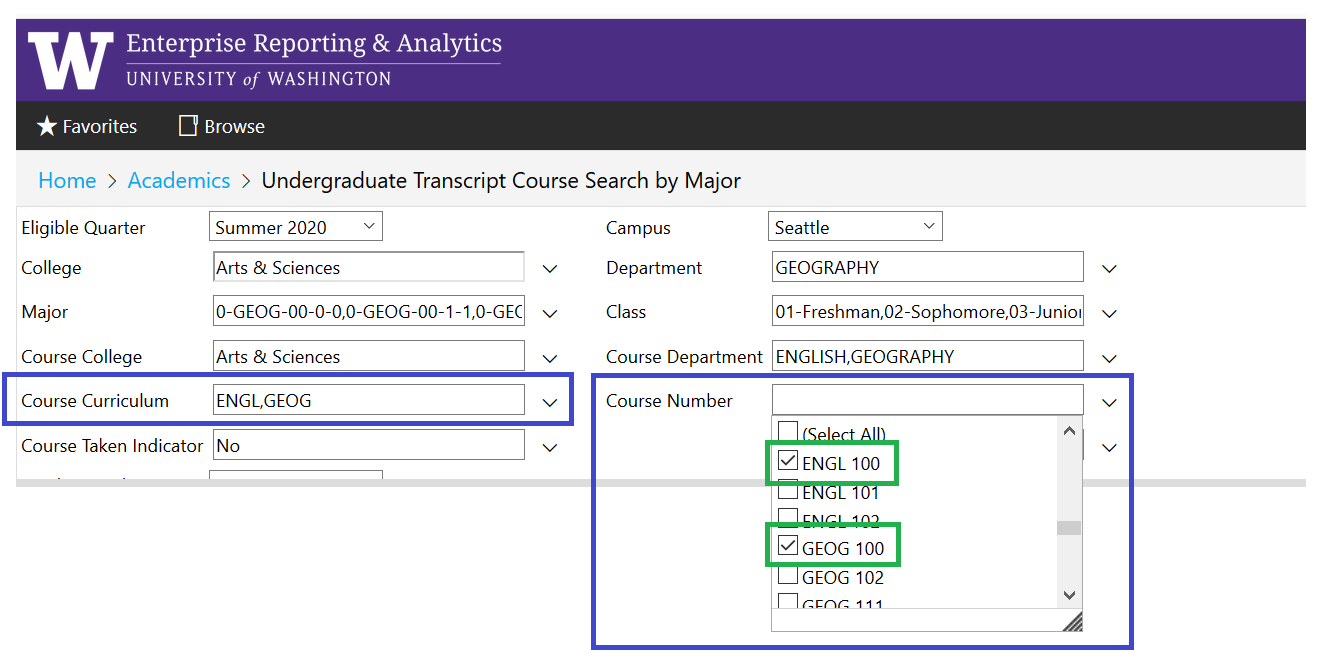
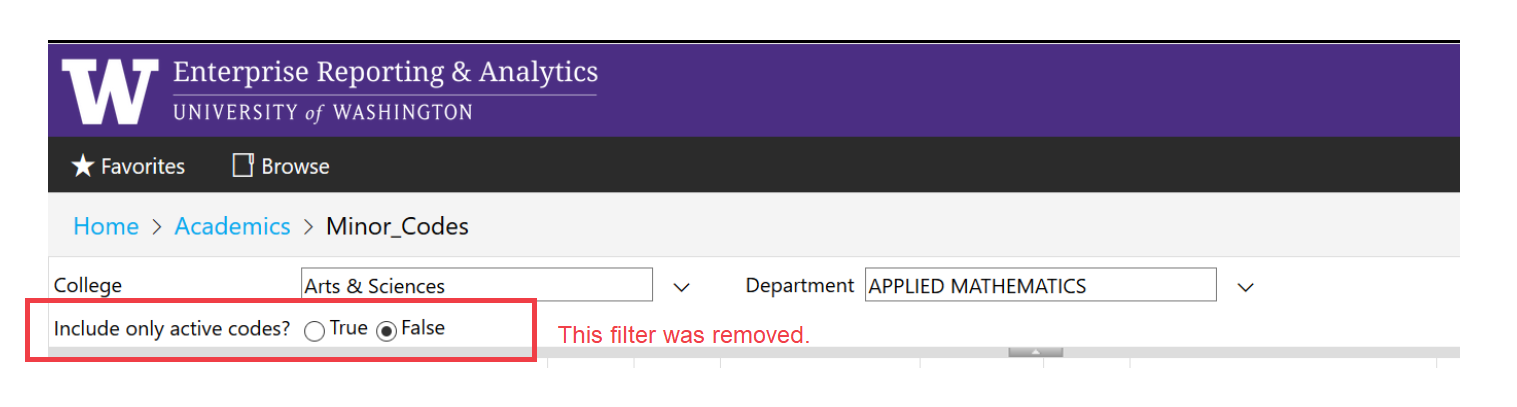
Many of our reports feature a filter that looks like this and lets you strip out formatting if you select “Data”:

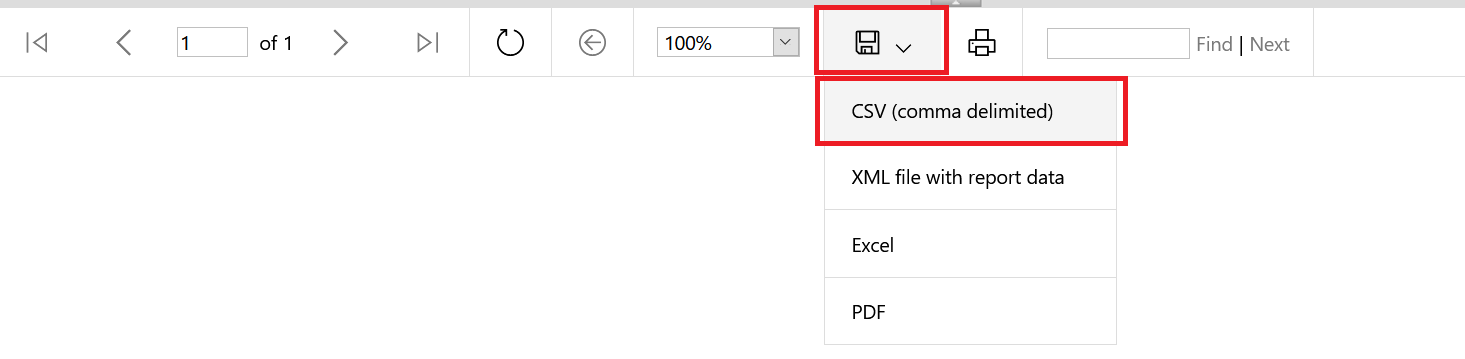
We are removing this filter from all academic reports. It is a legacy filter that is now obsolete with new built-in export options. If you want a clean export of the report data, you can now select “CSV” from the Export menu:

The CSV export option strips out the header, footer, and additional formatting, and gives you just the data in an Excel workbook.
3. We simplified the Export Options!
The report export dropdown used to include lots of unnecessary export options including (TIFF, MHTML, etc.). We streamlined the dropdown to only include the relevant export options. See for yourself!
The CSV export option strips out the header, footer, and additional formatting, and gives you just the data in an Excel workbook.
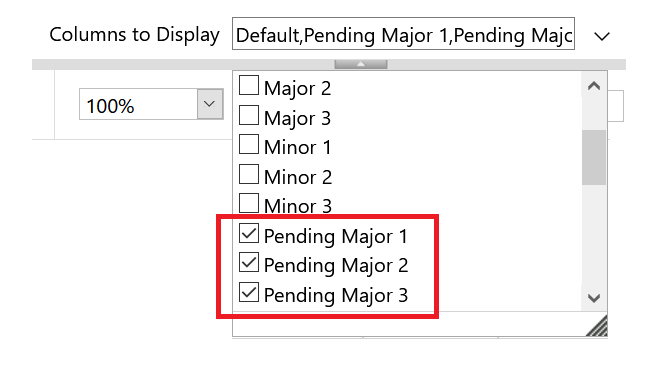
4. We are applying these changes to all reports, for a consistent look and feel
The reports in the BI Portal were developed over the course of a decade. As a result, they have very inconsistent formatting. This introduces confusion for our users, and makes maintaining and testing reports more time-consuming than it needs to be.
We’re taking this:
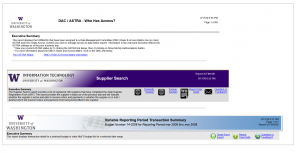
And turning it into this:

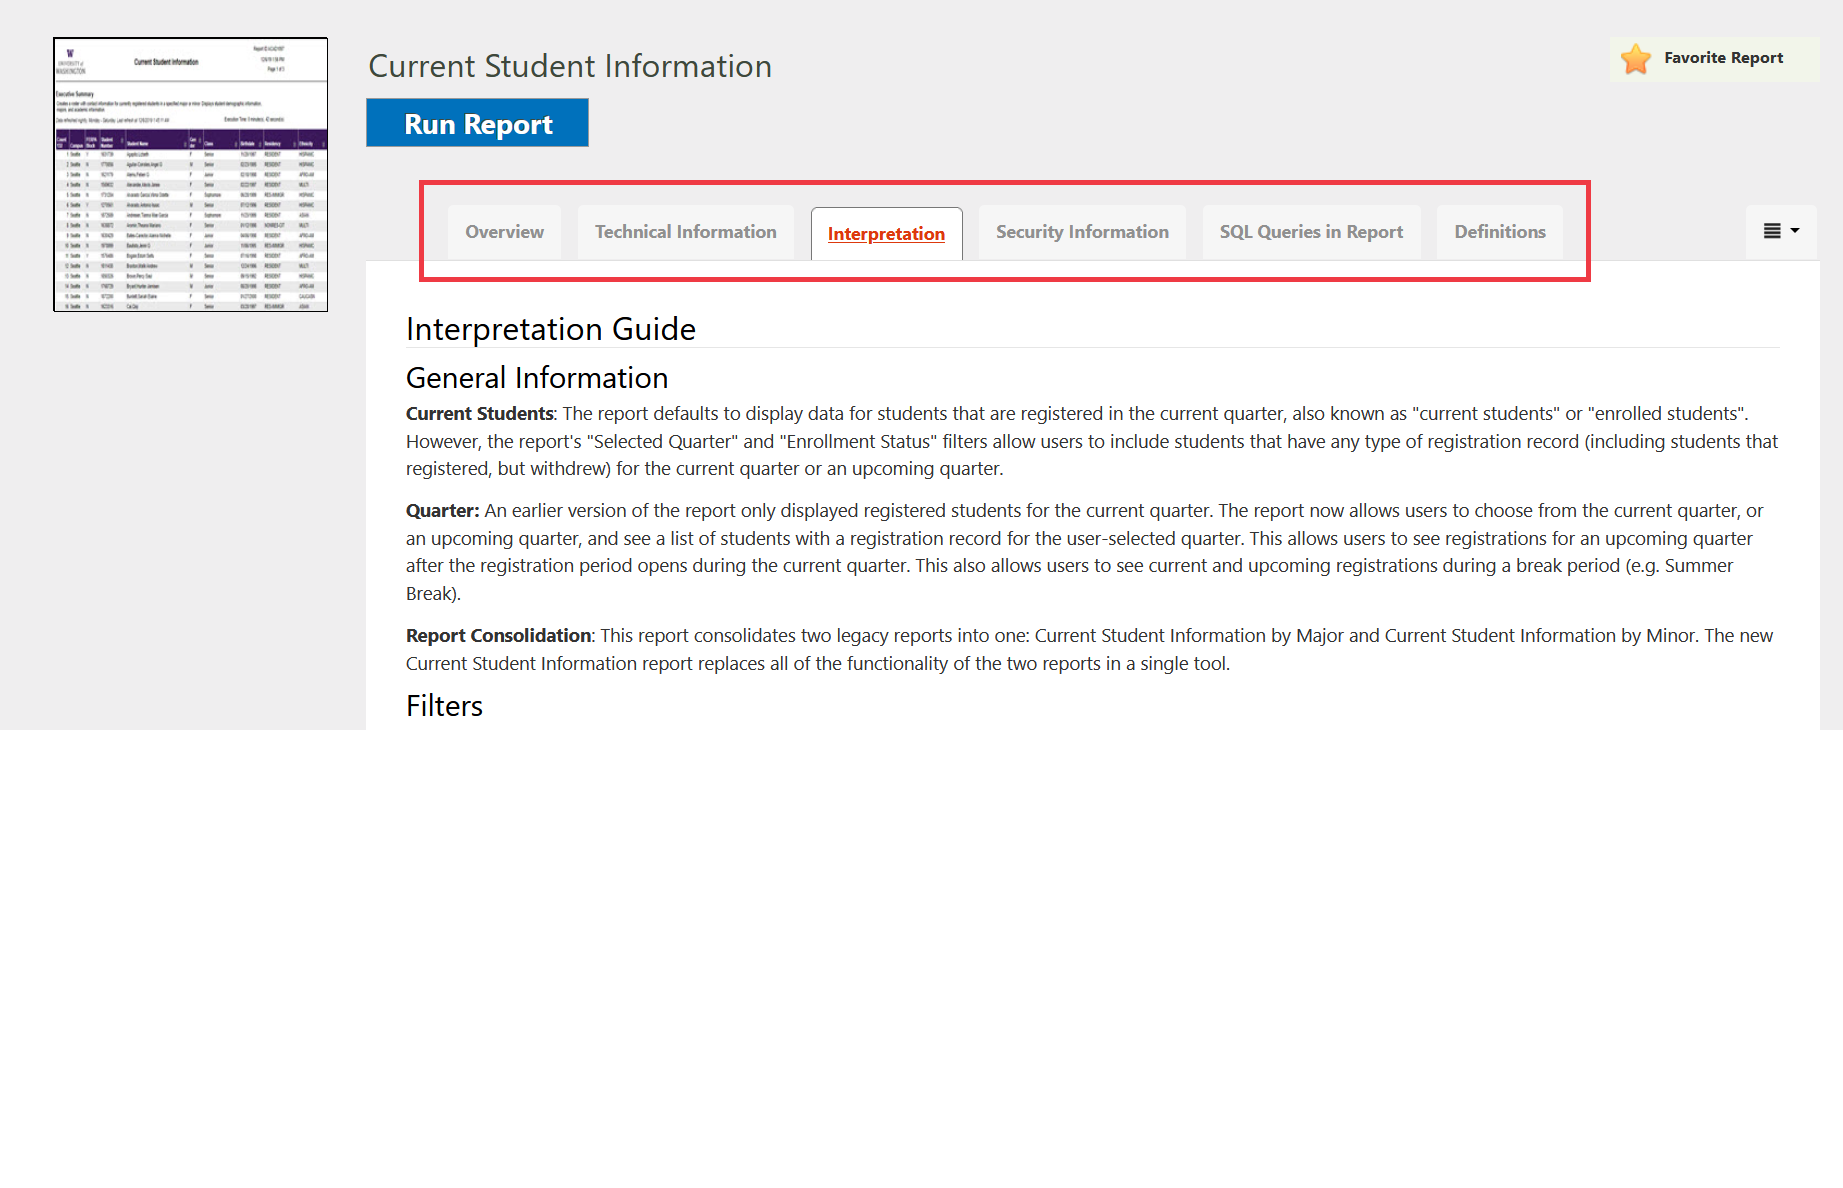
But don’t worry, the important contextual information for your reports is still available in the BI Portal! The only change is that from now on we are only going to maintain it in the BI Portal. See for yourself!
5. Finance Reports: We are not removing the “clean XML export” (We promise!)
On many finance reports, there is a note like this one on the Forecasting Template: “choose “XML file with report data” from the Export dialog above”. The XML export feature cleanly exports this heavily formatted report to a version in Excel that resembles the report in the browser.
Based on user feedback, we learned this is a very valuable feature to our users, and we will not remove it!
6. We are making reports easier to maintain!
When you’re running your report in your browser, this may look like a trivial formatting update. But behind the scenes, it is a very important change for the team that supports the reports you access in the BI Portal. This work will enable us to more quickly update and deploy the data tools you need to do your work.
7. What is the timeline for these changes?
We are beginning to publish these updates in August 2020, and hope to have the work completed by November 2020. We’re implementing these updates iteratively, so the next time you run a report you may see the updates. Please be patient with us while getting familiar with the new fit and finish.
8. Research Reports: No More Big Green Button
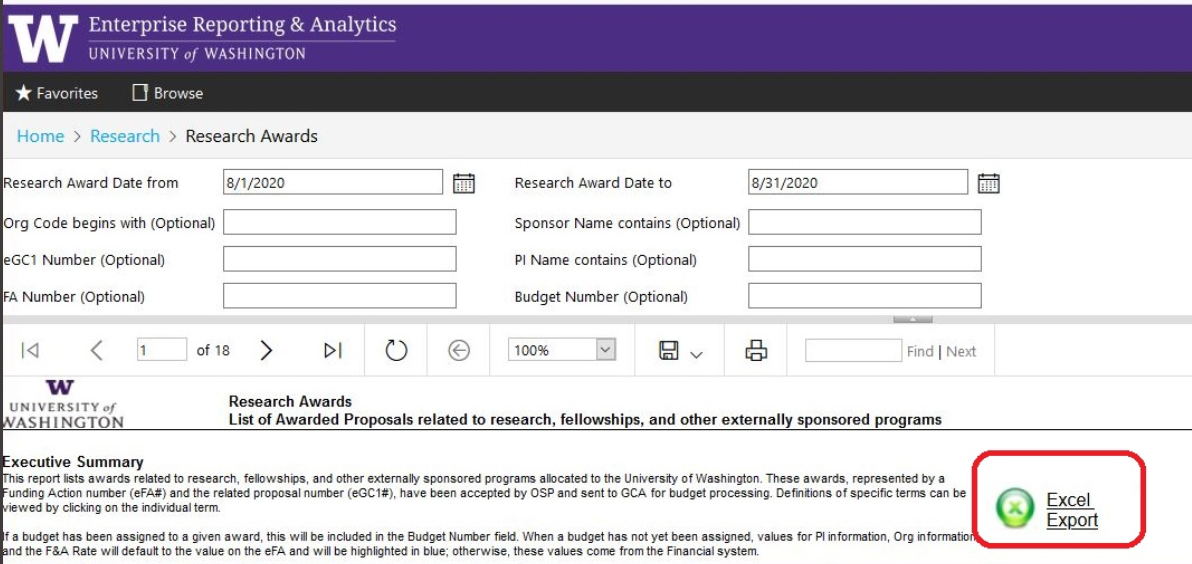
If you use Research Reports you may be familiar with the Big Green (export) Button on the Research Proposals and Research Awards Report. It looks like this:
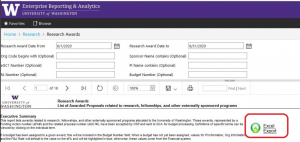
In this series of formatting updates, we removed the Big Green Button in favor of the CSV export option in the built-in export dropdown. The big green button is a legacy feature that is now obsolete with new built-in export options.
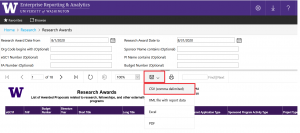
Many users of the Research Reports export the reports to Excel, then put the data in a pivot table to work with it. If this is your approach, we recommend that you use the CSV export option to get a “clean” and unformatted dataset to work with.
Additionally, if you’re using the Research Proposals or Awards reports in this way, we also recommend that you try to ResearchAdminData Cube! You can learn more about cube training options here: https://www.washington.edu/research/research-administration-learning/research-administration-data-cube/
Questions?
As always, if you have any questions at all, please don’t hesitate to write us at help@uw.edu with “BI Portal Report Format Updates” in the subject line.