On the evening of February 9, 2021, the EDW will be upgrading our user-facing servers (EDWPub.s.uw.edu) to SQL Server 2019. This upgrade will position the EDW to take advantage of modern SQL features, as well as allow for greater flexibility as computing and technology needs evolve.
Impact
We believe this upgrade will have minimal impact on our users. However, we recognize that with any upgrade to a newer version of a relational database management system, there is potential to introduce a compatibility issue with tools or systems that interact with our servers. With this in mind, we have set up an EDW Preview Server for our users to validate before the February 9 production release.
Accessing the EDW Preview Server
The Preview server is available for testing now. We encourage you to test and give us feedback by the end of day January 15, 2021.
Here’s how you can test:
- Direct your query tool or system to EDWPubPreview.s.uw.edu
- Validate that queries run with no error
- If you rely on batch processes, validate that they still run successfully
Known issues
Invalid version error
When connecting to SQL Server 2019, your query tool may return an ‘Invalid version’ error similar to the one below:
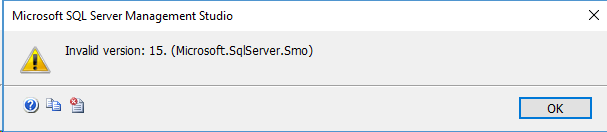
You can resolve this error by updating your query tool to the latest version.
The latest version of Microsoft SQL Server Management Studio is available for download here: https://docs.microsoft.com/en-us/sql/ssms/download-sql-server-management-studio-ssms
ODBC driver not compatible
In order to connect to SQL Server 2019, your ODBC driver needs to be Version 17.3 or higher. The latest ODBC driver for SQL Server is available for download at:
https://docs.microsoft.com/en-us/sql/connect/odbc/download-odbc-driver-for-sql-server?view=sql-server-ver15
Reporting issues or requesting additional time
We ask that you test at your earliest convenience and acknowledge that you may require additional time. If you experience any issues you are not able to resolve or if you require additional time to validate, please write help@uw.edu and put “EDWPubPreview” in the subject line.
The Report Prioritization Group just released a bug fix on the BI Portal report Undergraduate Transcript Course Search by Major
In this news story we provide a summary of the change. If you have any questions, please don’t hesitate to write help@uw.edu and put “BI Portal Report Question: UG Transcript Course Search by Major” in the subject line.
Change Summary:
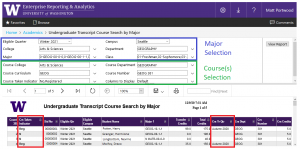
Based on user feedback, we resolved an issue in the report logic that was causing students that are registered for a selected course to display as “N” or not registered:
-
For a selected course, show me my majors that are Registered, or have not taken the course:
- This is one of the primary use cases for this report. As an adviser I want to see the following:
- Among my majors
- For a given course (or courses)
- Who has not taken the course and who is currently registered for the course
- Previously the report incorrectly displayed students that are registered for a course as “N” indicating that they have not taken it. This was incorrect and we fixed it.
- The report now correctly displays “Reg” if a student is registered for the chosen course.
Questions?
For more details on the release of this new report, please read this news story in IT Connect: RPG New Report Release: Undergraduate Transcript Course Search by Major
This report references important institutional concepts like “Eligible to Register“, “Student Hold” and many others. If you have questions about the meaning of these or any other terms, please explore the links or find more detail in the Knowledge Navigator.
As always, if you have any questions, please write help@uw.edu and put “BI Portal Report Question: UG Transcript Course Search by Major” in the subject line.
The Data Platform uses ASTRA to manage access to Enterprise Data Warehouse (EDW) data. The recent release of ASTRA 2.1 includes a new auto-deprovisioning feature that will monitor and automatically remove access for terminated employees.
As of December 7, 2020, the EDW is now using ASTRA 2.1 and taking advantage of its new features. The deprovisioning process was previously accomplished via manual review. This automation greatly reduces the risk of inappropriate access to EDW data.
How may this affect you?
- EDW authorizers will benefit from the improved efficiency of automated removal of authorizations. It is still recommended that you continue to review authorizations for terminated employees, job transfers, and others who no longer need access to applications. ASTRA will continue to email quarterly status notifications as reminders.
- EDW users should experience no change in service unless their status changes (e.g. they leave UW). In that case, some user authorizations will be automatically deprovisioned at the time of status change. The EDW Access request process remains unchanged.
A complete overview, including FAQ on the ASTRA 2.1 release, is available at: https://it.uw.edu/security/iam/access/astra/deprovisioning/
Questions or concerns?
If you have questions or concerns, please email us at help@uw.edu with “EDW and ASTRA 2.1 Deprovisioning” in the subject line.
The Report Prioritization Group just released two enhancements to the BI Portal report Major Codes.
This report helps advisers complete the change of major process, and these updates were designed to make it easier to find the info you need to complete the new Docusign web form: Change of Major Forms
This update was requested by a UW adviser and several advisers contributed feedback to the update. Thank you for your help!
Change Summary:
Based on user feedback, we updated the Major Codes filters and columns in the following ways:
Filter Updates
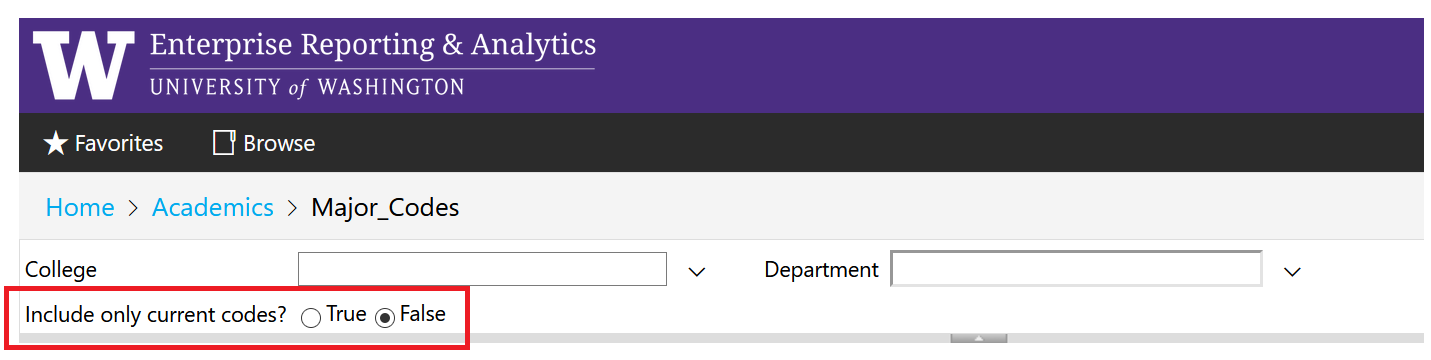
Here’s the filter before:

In the old version of the report, the “Include only Current Codes” filter was causing confusion. We heard things like:
- What is a current code?
- What if a code is active for 2 more quarters? Why is it being excluded?
We updated the filter to allow you to choose from three specific statuses for Major Codes:
- Active
- No longer active
- Not yet active
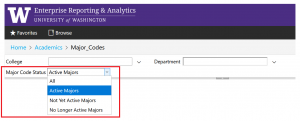
A Major Code is considered “No longer active” if it has an end date in the past. A Major Code is considered “Not yet active” if it has a start date in the future. All other Major codes are considered Active, whether they have no end date, or whether their end date is in a future quarter.
New Columns
We also updated the column order to improve the usability and added several new columns:
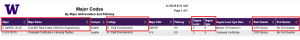
- Major:
- We added a column “Major” with the full Major label as a reference to help you quickly identify the major you’re interested in.
- We moved the Major Name to the 2nd column, also as a quick reference.
- College:
- We added the College name to the College column as a reference.
- Degree Level and Type:
- We added these fields because the form requires it.
- Start and End Quarter:
- We broke these out as separate columns so they’d be more readable.
- Department Name and FAS Org Number:
- We added these fields for departments that need to cross-reference department info in the FAS financial system.
Questions?
This report references important institutional concepts like Change of Major, Student Major and many others. If you have questions about the meaning of these or any other terms, please explore the links or find more detail in the Knowledge Navigator.
As always, if you have any questions, please write help@uw.edu and put “BI Portal Report Question: Major Codes Report” in the subject line.
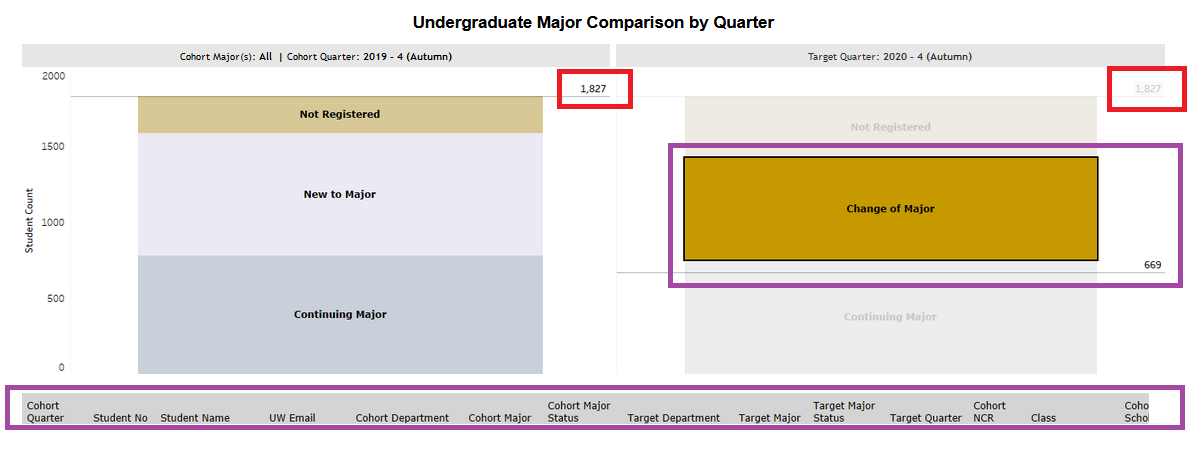
The Report Prioritization Group just released the newest addition to the BI Portal: Undergraduate Major Comparison by Quarter
In this news story we explain the purpose and benefits of the new visualization. If you have any questions, please don’t hesitate to write help@uw.edu and put “BI Portal Report Question: UG Major Comparisons by Quarter” in the subject line.
It’s All in the Name!
We admit, the visualization has a long name, Undergraduate Major Comparisons by Quarter. But each word explains something about the tool’s function.
- Undergraduate Major: This report allows you to see a population of Undergraduates associated with a major in a given quarter. This dashboard only looks at Undergraduates because an undergraduate can change majors throughout their academic career. They may start as “Pre-Major” then declare a major later, or once they’re “in a major” they may move to another one from quarter to quarter.
- Comparison by Quarter: This visualization allows you to compare a cohort of students across two “reference quarters” like Autumn 2019 and Autumn 2020. The bar on the left shows you the students “in the major” in the first quarter, then shows “where those students were” in the second reference quarter.
How-To:
First, use the quarter filters to choose the two reference quarters that you want to see:
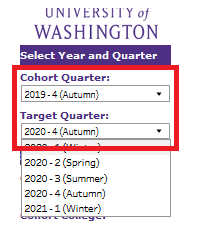
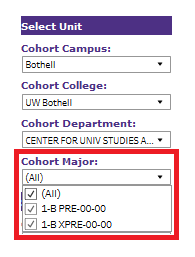
Use the second set of filters to identify the major(s) you want to visualize:
The bar on the left shows you students associated with the major in the “cohort quarter”, the bar on the right shows you the same cohort of students in the future “target” quarter.
You can click a comparison category to filter the detailed table below the bars!

Users and Use Cases:
The primary audience for this report is the academic advising community, and several UW advisers provided significant input on the report’s design! The following are real use cases from our data user community:
The visualization has three primary use cases:
- Advisers in Pre-Major Programs need to:
- Observe if a student leaves a program at a given campus and joins a program at another campus.
- Observe if a student stays at at a given campus, and declares a major. In that case, they want to know the major they joined, and the department that manages it. This helps them to allocate time partnering with those departments so that they can better represent students.
- Departmental Advisers (those who are responsible for students after they ‘declare a major’ e.g. Geography, Computer Science…)
- Observe changes to the population of students they are responsible for. Here, they want to see the ‘flow of students in and out of the major’.
- Advisers can track students in given majors who are not registered for both incoming quarter (Cohort Quarter ) and/or outgoing quarter (Target Quarter)
Questions?
This report references important institutional concepts like Change of Major, Underrepresented Minority Status, and many others. If you have questions about the meaning of these or any other terms, please explore these links or find more detail in the Knowledge Navigator.
As always, if you have any questions, please write help@uw.edu and put “BI Portal Question: UG Major Comparison by Quarter” in the subject line.
In response to user feedback, the Enterprise Reporting and Analytics team just released an update to resolve a bug in the Salary and Wage Expense Detail report in the BI Portal.
Change Summary:
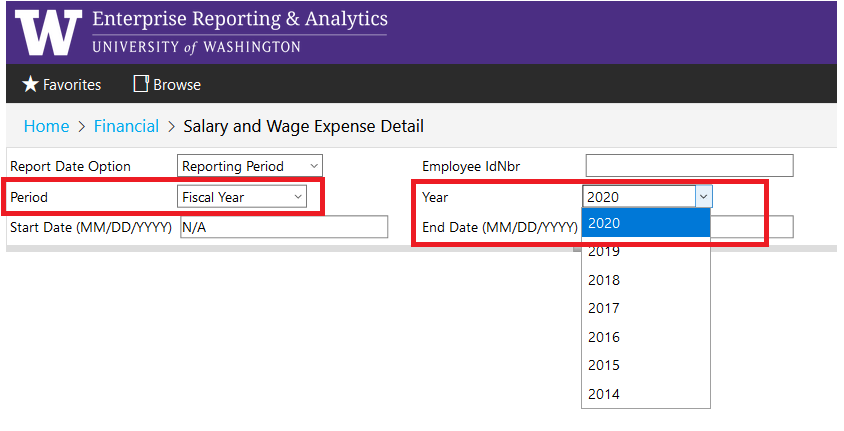
A user reported that the “Year” filter was excluding the current Fiscal Year (2021). By default, the report filters by Calendar Year, but you can filter by Fiscal Year by choosing “Fiscal Year” from the “Period” Filter.
This is what the filter options looked by before the update:

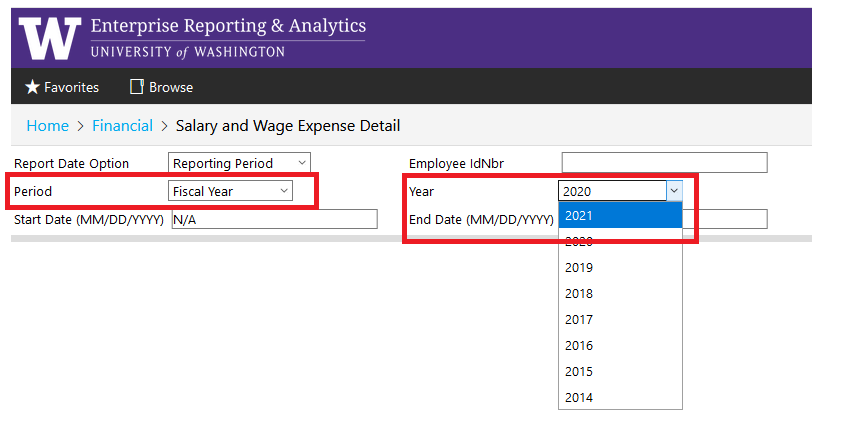
And after the update. You can now select the current Fiscal Year!

Additional Resources:
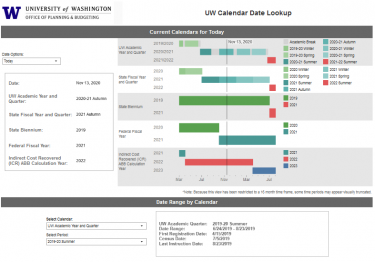
It can sometimes be confusing to keep all of the different financial years straight, “it’s 2020, and we’re in the 2021 FY, but the 2019 Biennium…”
For a quick reference, we recommend you try the UW Calendars dashboard on the BI Portal! This tool shows you for today, or any date, where the UW is at on the academic calendar, federal fiscal calendar, state biennium calendar, and so on. See for yourself: UW Calendars
Also, we’re updating our report format for a simpler and more modern look and feel. To read more about these changes, check out this news story: 8 Things You Should Know About Our BI Portal Report Format Updates
Questions and Feedback:
This report references many UW institutional concepts, including Account Code and Budget Number. To get detailed definitions for these and other terms, please check out Knowledge Navigator!
As always, if you have any questions or if you would like to provide feedback, please write help@uw.edu and put “BI Portal Question: Salary and Wage Expense Detail” in the subject line.
In response to user feedback, the Report Prioritization Group just released an update to resolve a bug in the Student Degree Information report the BI Portal.
Change Summary:
A user let us know that the report was incorrectly duplicating students. We identified the issue and determined that the report was displaying multiple identical rows for students that had multiple applications to UW. We resolved this so that the report no longer duplicates rows for students with multiple UW applications.
Please note, the report does intentionally display multiple rows for students in other cases, such as:
- When a user chooses multiple Degrees and a student has earned (or applied) for more than one degree in the filter list
- When a student earns (or applies) for more than one degree in a selected quarter
- When a student earns (or applies) for more than one degree in a quarter other than the selected quarter.
To see examples, please try out the “Report Type” filter!
In this release, we also added an interpretation guide to the BI Portal for this report. If you’ve ever wondered how the “Report Type” filter works, or what the rules are for the colorful rows, that’s all written up in the Interpretation Guide! See for yourself:
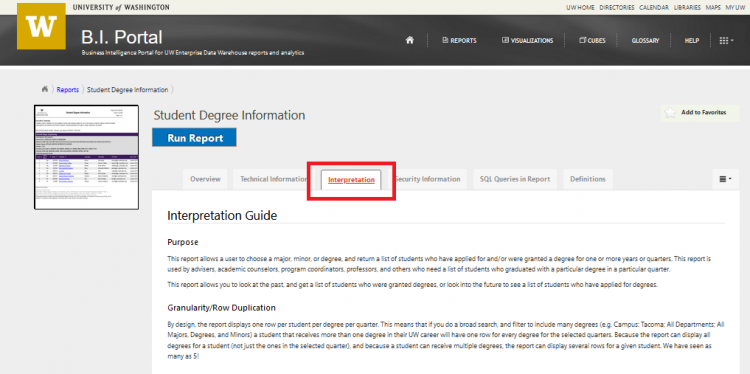
Questions and Feedback:
Don’t forget, we are currently updating our report format to a simplified and modern look and feel. For a summary of these changes, please read: 8 Things You Should Know About Our BI Portal Report Format Updates
This report references many UW institutional concepts, including UW Grade Point Average and Degree. To get detailed definitions for this and other terms, please check out Knowledge Navigator!
As always, if you have any questions or if you would like to provide feedback, please write help@uw.edu and put “RPG: Student Degree Information report” in the subject line.
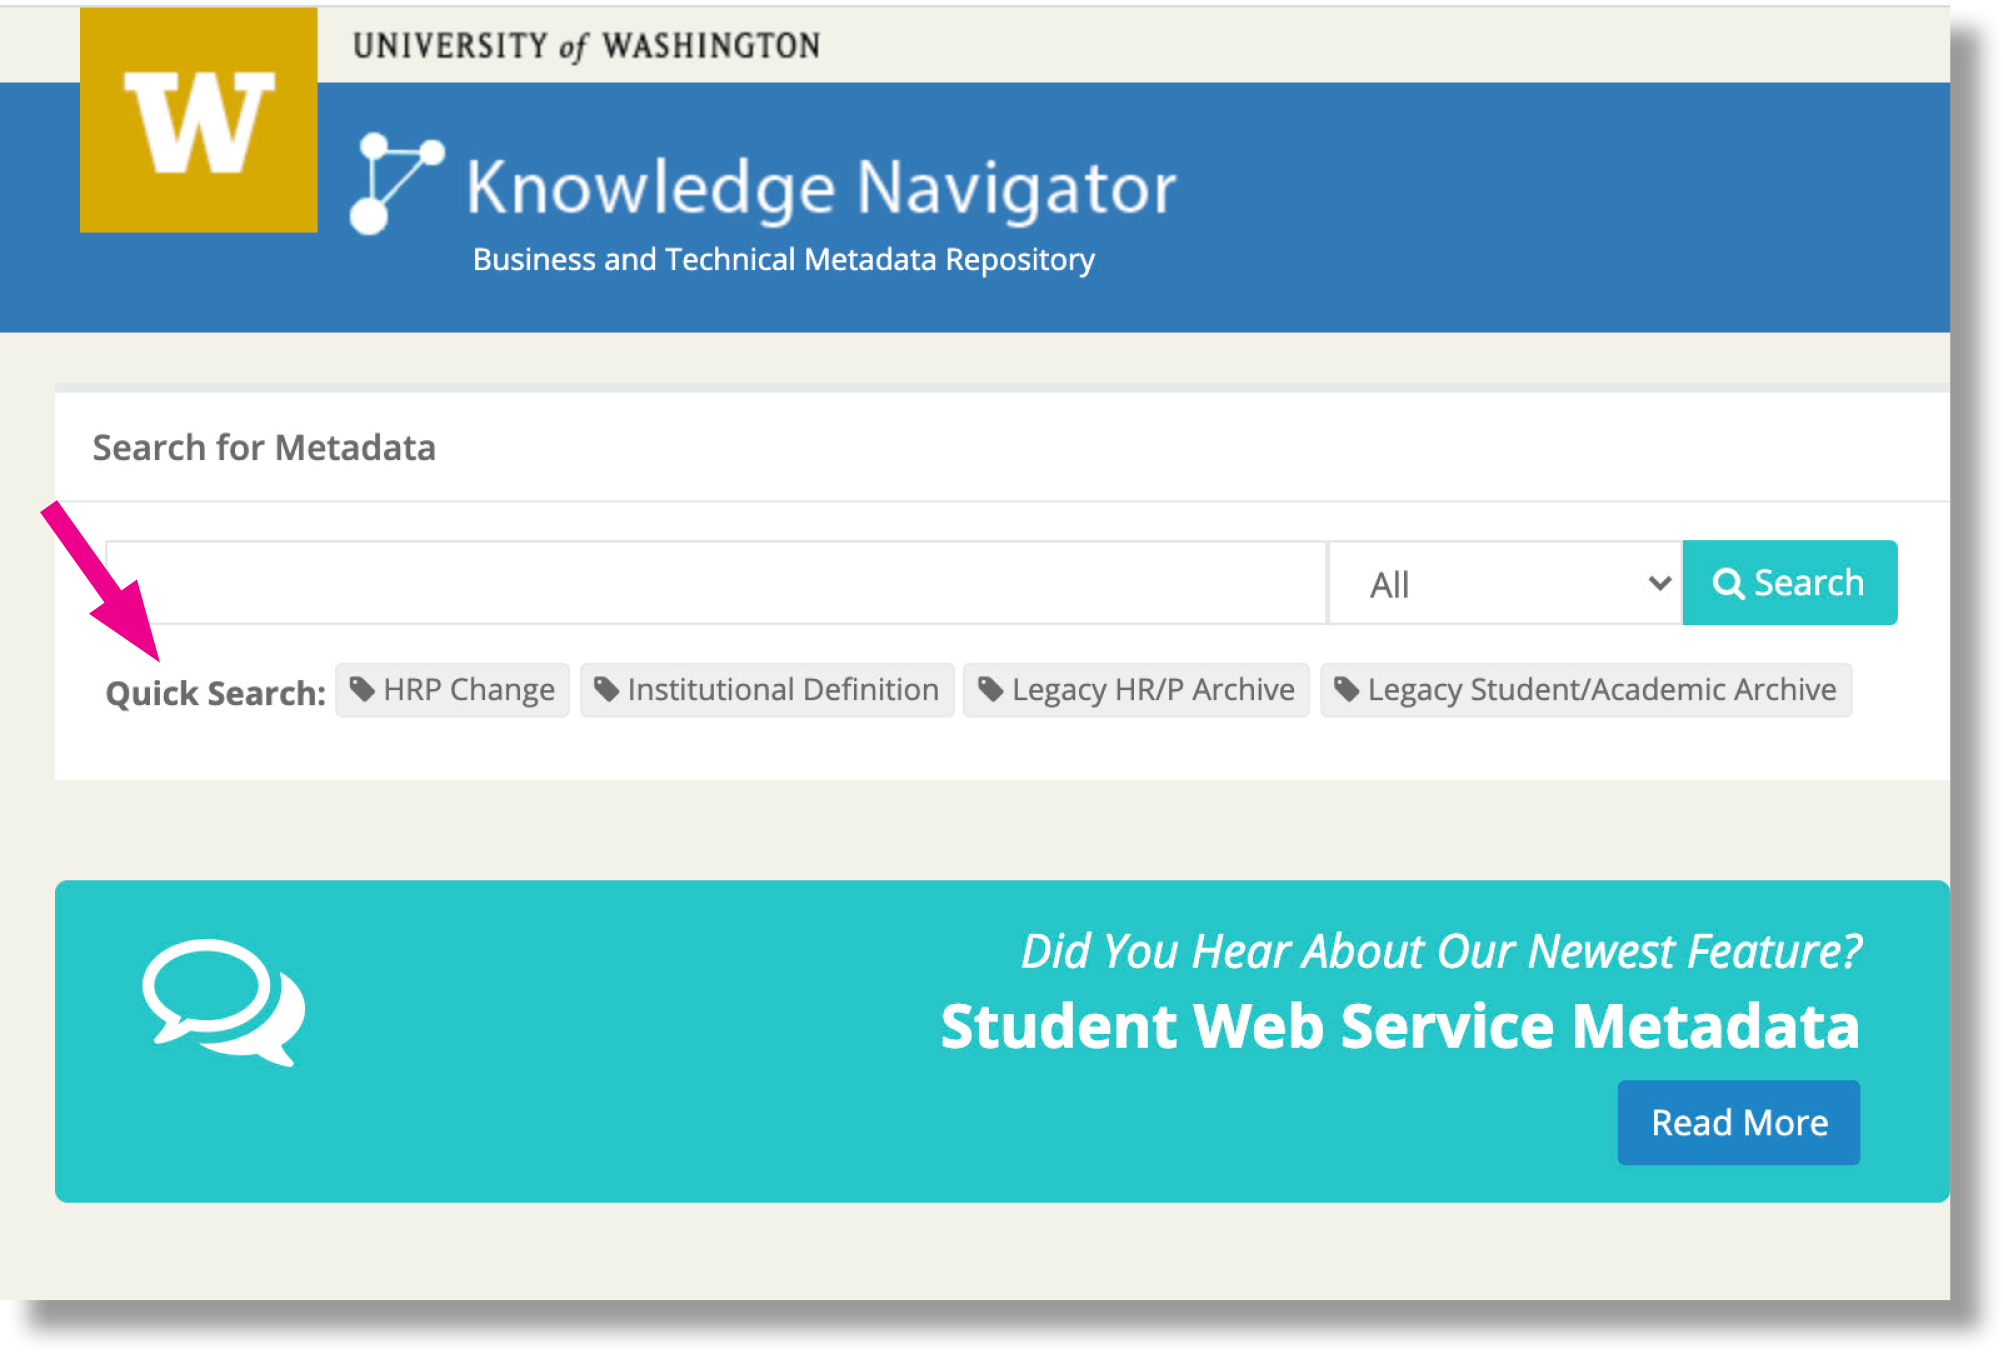
The meta tag feature in Knowledge Navigator (KN) https://metadata.uw.edu has been expanded to provide one more tool to help you search for categorized metadata objects.
What are meta tags?
Just like the categories on a blog or keywords in a search tool, meta tags help you find all content that is related by that category or keyword.
Where do I find meta tags in Knowledge Navigator?
- Meta tags are shown under the search field on KN’s home page next to the words “Quick Search.”

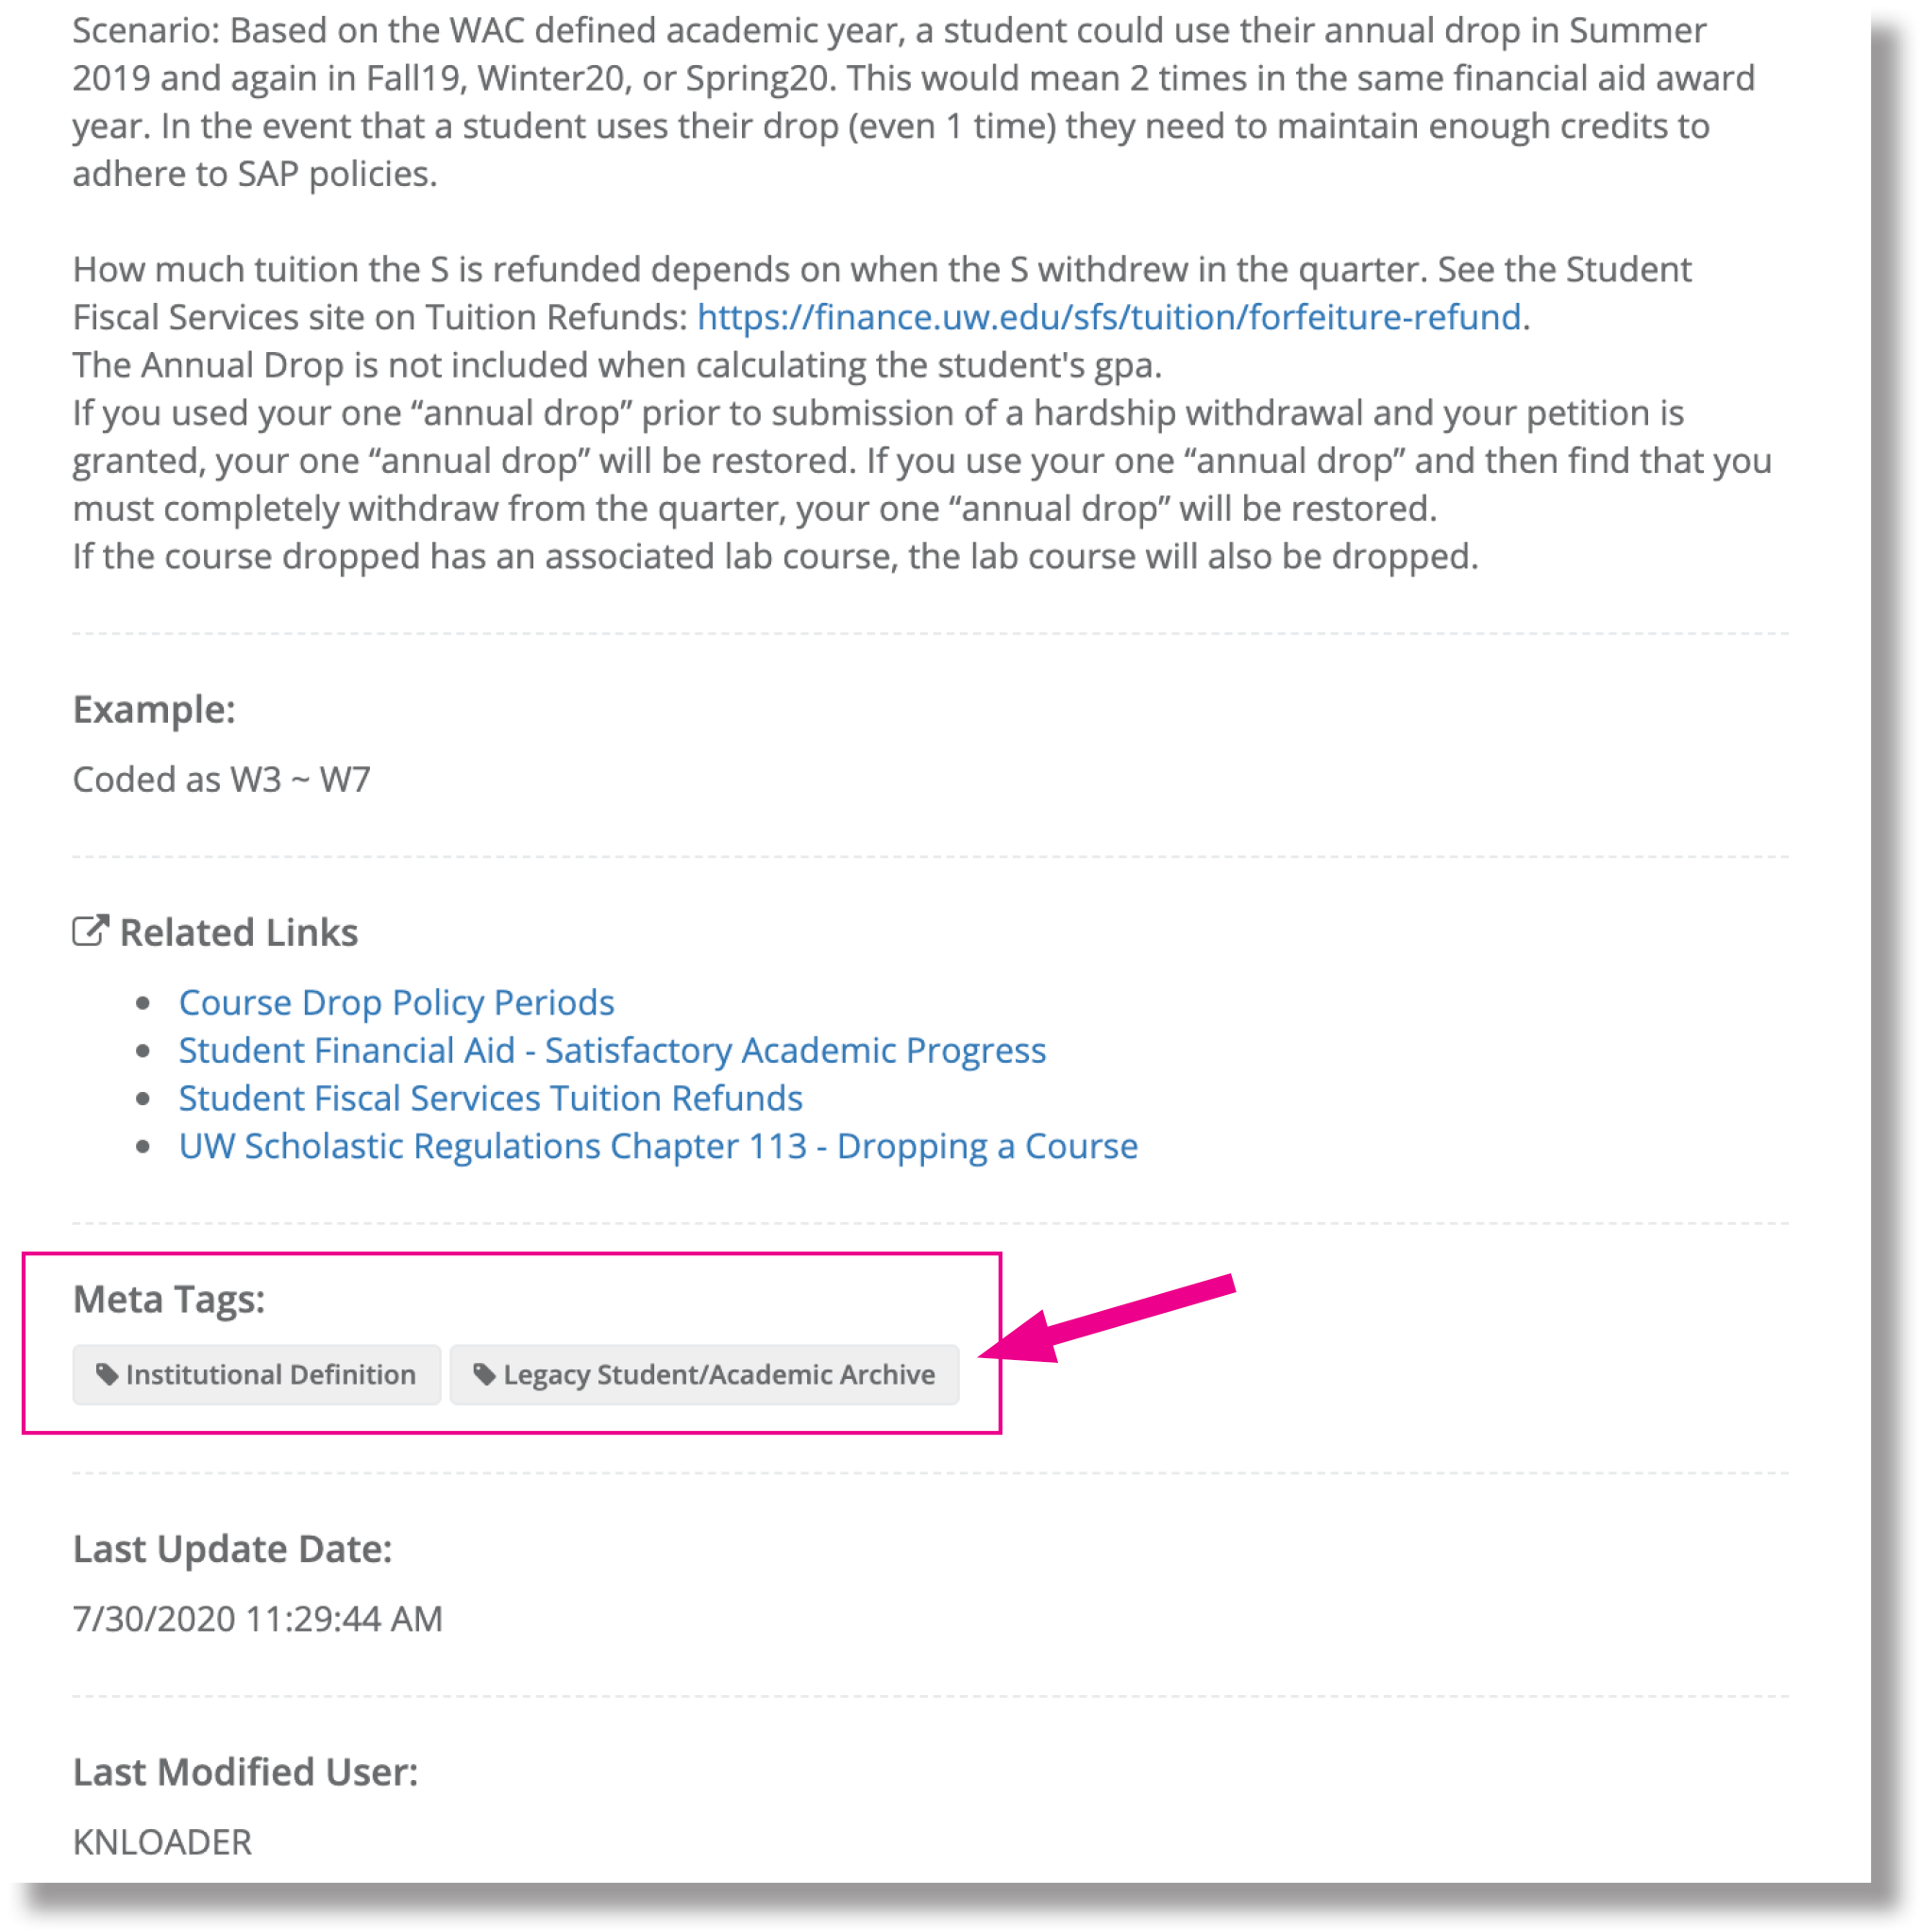
- Meta tags can also be found under Details > Meta Tags: on a metadata object’s page.

See the above example at https://metadata.uw.edu/Catalog/ViewItem/Term/9fff2571-071f-455c-a3da-57abaae64336
How can I use meta tags?
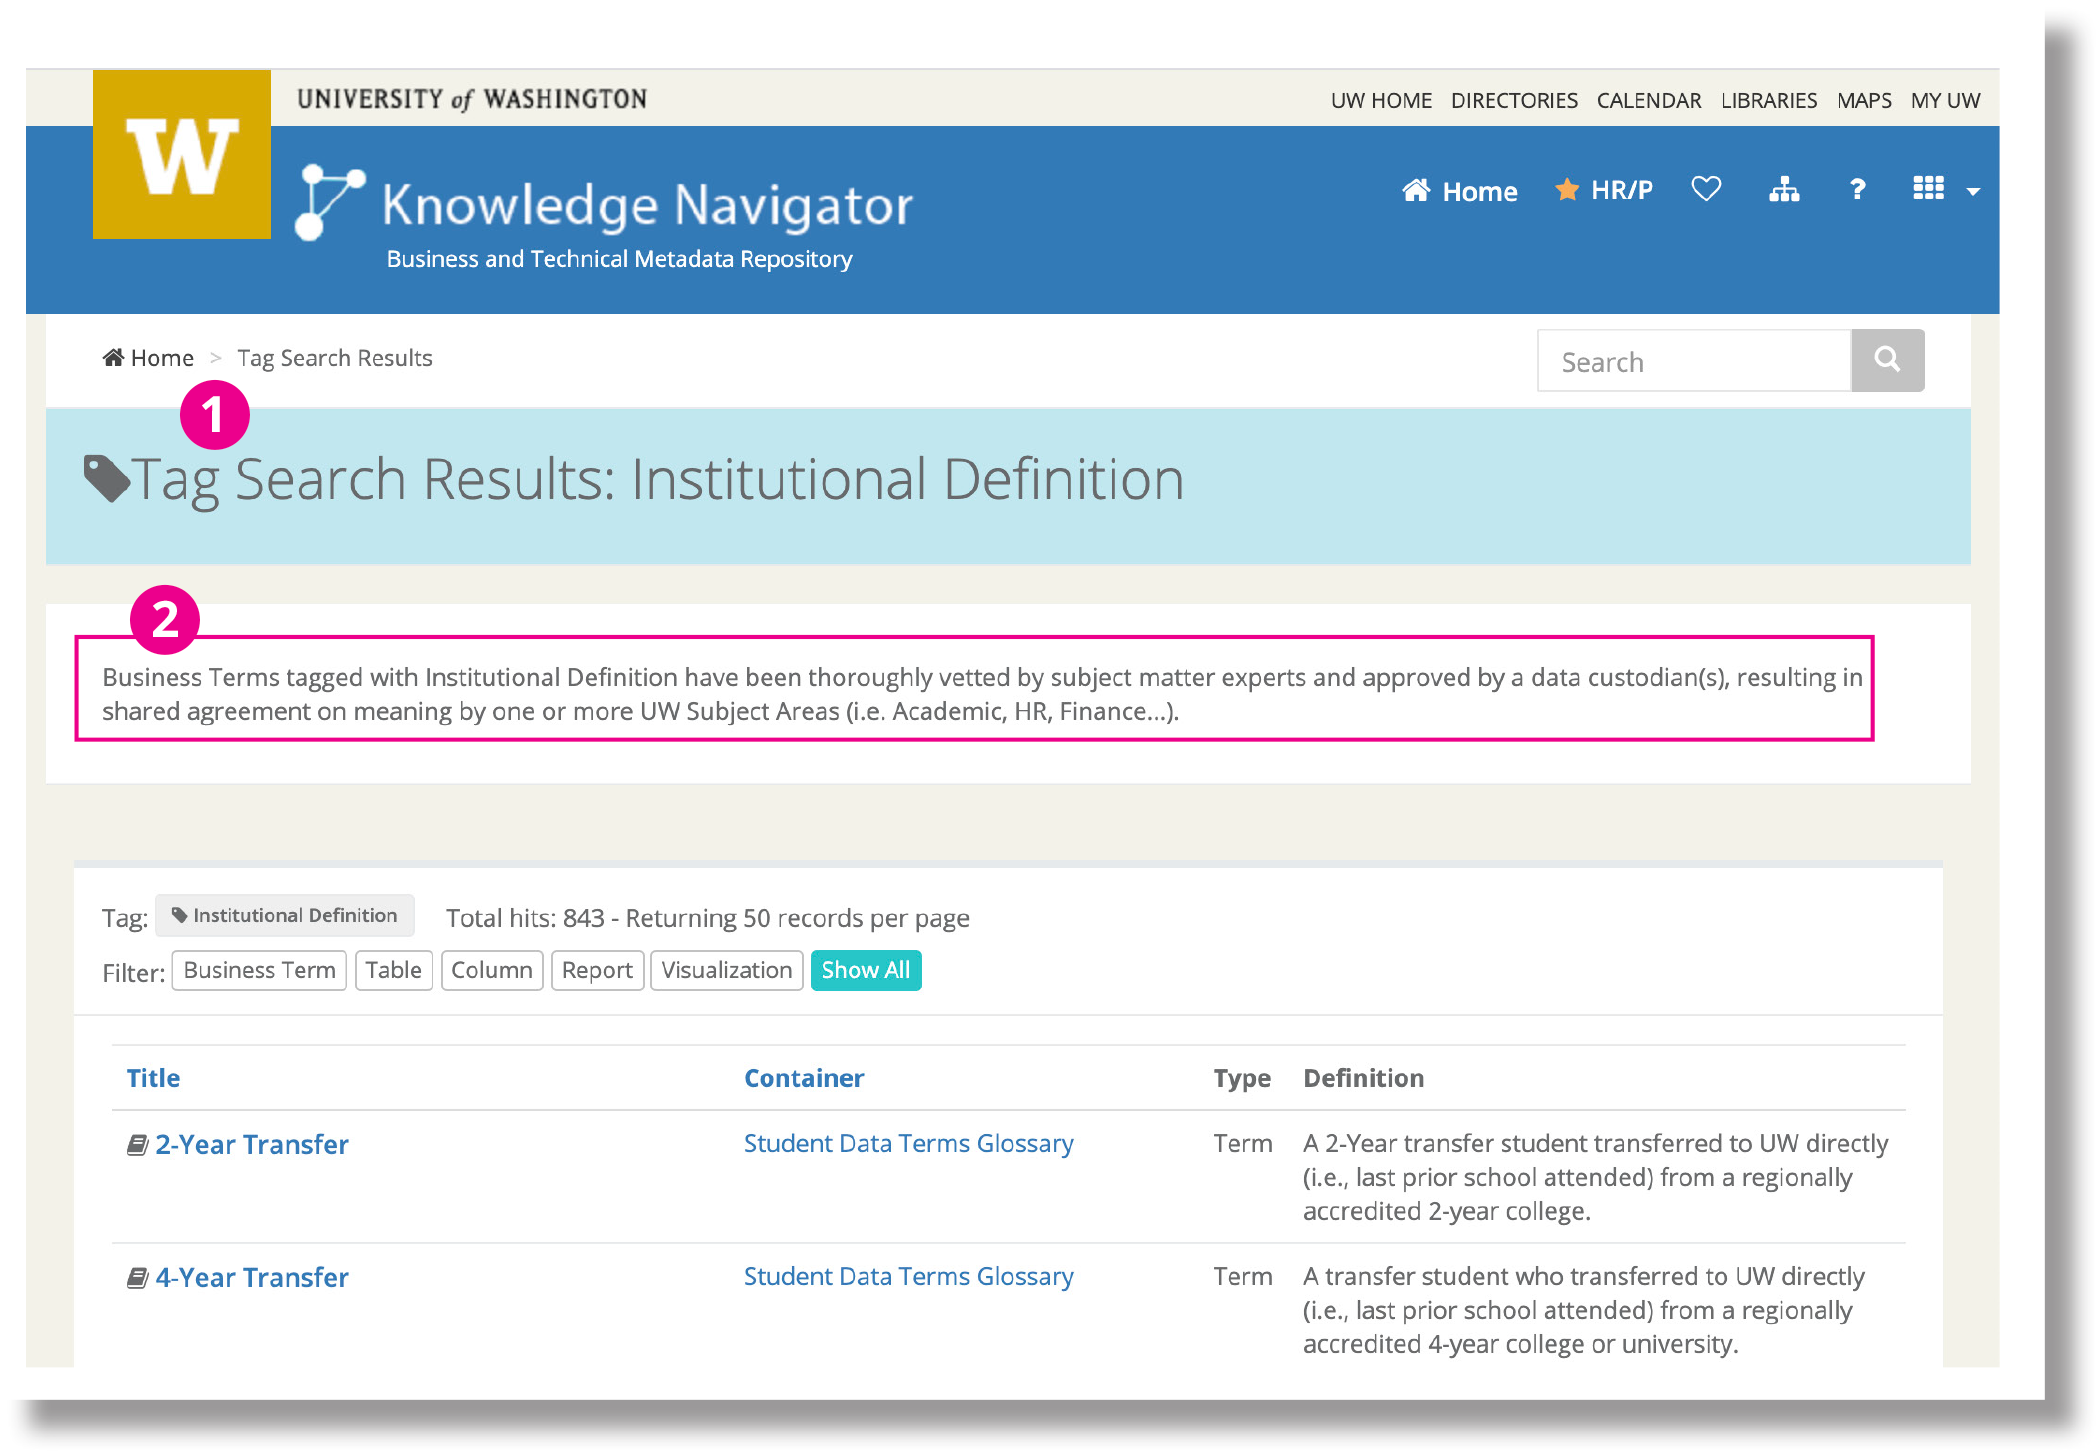
Use meta tags for targeted searching of categorized metadata objects. Click on a meta tag to navigate to a Tag Search Results page which will display all metadata objects with that meta tag.

- Tag Search Results page for the meta tag Institutional Definition. See this example at https://metadata.uw.edu/search/tags?tag=fc400488-e5bc-11e7-80c1-9a214cf093a.
- A description details why the set of metadata objects has been categorized with this particular meta tag. For example, the Institutional Definition meta tag categorizes Business Terms that have been approved by a Data Steward.
Where do meta tags come from?
Meta tags are created on an as needed basis by the Metadata Manager. To suggest a new meta tag, please contact help@uw.edu. Use “KN Meta Tag Suggestion” in the subject line.
Need help or have questions? Send an email to help@uw.edu with “KN meta tags” in the subject line.
The student database (SDB) will go through a reorganization on October 24, 2020 which will cause changes in the Enterprise Data Warehouse database, UWSDBDataStore. These changes to the objects will be available in the UWSDBDataStore on Monday, October 26, 2020.
However, data on the new objects will be available as soon as the Data Custodians submit the security role definitions and the SIS team loads the data.
(last modified: 10.26.2020)
*Please Note:The scope listed below isn’t final until 1 week before the reorg. Please continuously monitor this site for the most current update.
New columns to be added
| Table Name |
Column Name |
Data Type |
Description |
| sf_evaluation |
sf_aut_enrl_lock |
char(1) |
Autumn Enrollment Lock |
| sf_spr_enrl_lock |
char(1) |
Spring Enrollment Lock |
| sf_sum_enrl_lock |
char(1) |
Summer Enrollment Lock |
| sf_win_enrl_lock |
char(1) |
Winter Enrollment Lock |
| s_sched1_data_fld |
char(1) |
Information about the data in the ‘student filed schedule’ 1 field |
| p_sched1_data_fld |
char(1) |
Information about the data in the ‘parent filed schedule’ 1 field |
| sf_tuition |
t_pt_10cred |
int |
Part-time tuition for 10 credits (prof) |
| t_pt_11cred |
int |
Part-time tuition for 11 credits (prof) |
| t_pt_12cred |
int |
Part-time tuition for 12 credits (prof) |
| student_2 |
finaid_docs_guid |
char(36) |
Unique 36-character GUID for every student in the Fin-Aid Documents CRM system. |
| time_schedule |
remote_learn_cd |
char(2) |
Track sections units offered in-person(IP), via remote learning(RL) and either(E) way. |
Data Type changes
| Table Name |
Column Name |
Old Data Type |
New Data Type |
| sr_adm_appl |
appl_source_id |
int |
decimal(10,0) |
| appl_copy_src_id |
int |
decimal(10,0) |
Send all questions and concerns to help@uw.edu, with the subject line: “UWSDBDataStore Reorg 10.24.2020“.
On Tuesday, October 6, 2020, the new 2020 CIP Series will be loaded into the Enterprise Data Warehouse. This affects any table that contains CIPKeyId. The tables that contain CIP code reference data are dimCIPCurrent and CIPAcademicYear in EDWPresentation.
What is included in CIP code updates?
Part 1: CIP codes with descriptions from the National Center for Education Statistics (NCES).
Part 2: Federal STEM (Science, Technology, Engineering & Mathematics) indicator provided by Immigrations and Customs Enforcement (ICE). This indicator is updated at irregular intervals. The most current data is from 2016.
Part 3: Washington State STEM indicators provided by the Office of Financial Management (OFM) in Olympia. This data is updated yearly.
- Currently we have CIP codes (part 1) with their descriptions from NCES.
- Federal STEM indicator (part 2) from 2016 matches what is currently in dimCIPCurrent and CIPAcademicYear.
- Washington State STEM indicators (part 3) will be delivered to us sometime in the near future from OFM.
What is being loaded into dimCIPCurrent and CIPAcademicYear?
The Office of Planning and Budgeting (OPB) has given us the authorization to load the new 2020 CIP codes, with mapping to the Federal STEM indicators from 2016 and Washington State STEM indicators from 2019. Once new STEM indicators from ICE and OFM become available, we will update them accordingly in dimCIPCurrent and CIPAcademicYear
How may this affect you?
- There are new CIP codes for 2020 that did not exist in 2010. A subset of these CIP codes has been entered into the Student Database (SDB). So you may see CIP codes that are in dimCIPCurrent or CIPAcademicYear but not in the SDB.
- The STEM indicators for 2020 CIP codes to be published, both from ICE and OFM, are mapped based on their relationship to 2010 CIP codes. When we receive new indicator values from ICE and OFM, the relationship may or may not be the same.
- The 2020 CIP codes that are not in the 2010 version will have no STEM indicators.
Why is dimCIPCurrent and CIPAcademicYear being loaded without all of the updated data?
There is a need throughout campus for these new CIP codes and STEM indicators. Since a subset of 2020 CIP codes has been added to SDB, and dimCIPCurrent and CIPAcademicYear are the only places storing the relationship between the CIP codes and the STEM indicators, OPB, Registrar, and the Graduate School have requested EDW to load and publish the data.
Questions or concerns?
If you have questions or concerns, please email us at help@uw.edu with “2020 CIP Codes” in the subject line.