2026 Survey: Results Recap
The 2026 UWIT Customer & Partner Experience Survey was distributed to all UW students, faculty, staff and researchers (UW population groups) across all three campuses in April 2026. The survey achieved statistically significant response rates across all UW population groups, with 2,776 total responses.
Key Takeaways
- Improved Satisfaction
Satisfaction scores for UWIT increased year-over-year across every UW group, Students, Faculty, Staff and Researchers, with top satisfaction drivers focused on fast response times and friendly, professional staff.- Overall Customer Satisfaction (CSAT) across the UW community increased from 3.9 (Moderate Satisfaction) in 2025 to 4.2 (High Satisfaction) in 2026, achieving UWIT’s target.
- Shared IT Ecosystem
Students, Faculty, and Staff experience IT as one connected ecosystem rather than as separate organizational units, reinforcing the need to address feedback through a “shared IT ecosystem” lens rather than by who technically owns a given service. - Partner Co-Ownership
UWIT Partners self-identified in the survey as staff members that collaborate with UWIT to support the needs of their Dept./Unit. These Partners want to be consulted as co-owners of IT decisions, not simply informed after the fact. Pointing to earlier, more collaborative engagement as the path to stronger strategic alignment. - Researchers, Satisfied Today, Uncertain About Tomorrow
Researchers report solid satisfaction with UWIT services and support, but a sharp decline in Net Promoter Score year-over-year, specifically among Faculty and Student Researchers, signals declining confidence in UWIT’s readiness to support where their work is going. Feedback points to research computing access (Hyak buy-in costs, GPU capacity) as the leading driver. - Progress on Unmet Tech Needs
The most important IT services and technologies needed but not currently provided by UWIT were technologies that UWIT has made great strides in providing in 2026.
-
- #1 Adobe Creative Suite & Acrobat Pro – the top unmet need for both Students and Staff.
UWIT Deliverable July 2026: Free & Low-Cost Adobe Software for the UW Community - #2 AI Tools & Access – Faculty’s top unmet need, #2 for Students, #3 for Staff.
UWIT Deliverable June 2026: AI Services & Support from UWIT
- #1 Adobe Creative Suite & Acrobat Pro – the top unmet need for both Students and Staff.
Acting on Feedback
In response to the survey results, UWIT is launching targeted efforts to improve customer and partner experiences. These initiatives directly address the feedback we received and are part of UWIT’s ongoing commitment to strengthening services and supporting the UW community.
- Targeting Responsiveness: UWIT is launching a Monthly Operations Review meeting to close the gap between what customers value most: fast, responsive service, and how consistently UWIT delivers it. Key responsiveness metrics will be tracked, so missed targets are caught early and routed to the right team for resolution. Rollout is phased, starting with a UWIT-only review and expanding toward a shared IT at UW review, bringing in partners from across the university to co-develop shared best practices.
- Shared Ownership of Community Feedback: Across IT at UW, opportunities exist to collectively interpret community feedback and co-design potential responses. This can inform IT Operational Excellence by helping identify opportunities to improve customer experience and reduce administrative burden across the university. Going forward, UWIT will approach campus engagement efforts, such as annual surveys, as shared initiatives with our partners to collaboratively interpret feedback, prioritize opportunities, and coordinate meaningful action.
2026 Survey Results
Read the complete results (PDF) of the 2026 UWIT Customer & Partner Experience Survey.
Survey Metrics and Scores
Customer Satisfaction (CSAT)
Customer Satisfaction, or CSAT, is a key performance indicator that measures how satisfied customers are with an organization’s products, services, or experiences. UWIT surveys our customers and partners (students, faculty, staff, researchers) across all three UW campuses to collect this feedback.
The Partner Satisfaction, or PSAT, metric is identical to CSAT but measures the satisfaction of UWIT’s Business Partners, specifically.
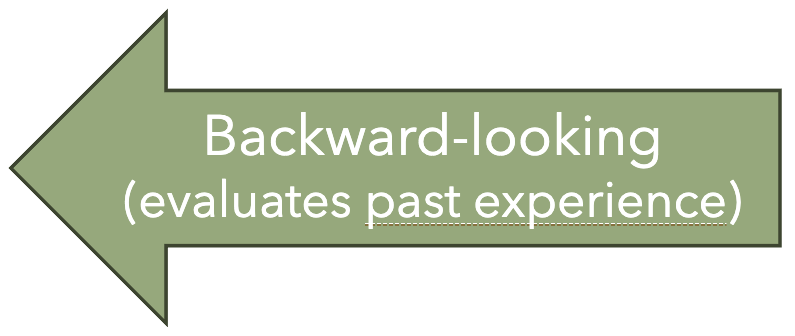
CSAT/PSAT are “backward looking” metrics, as they evaluate past experience.
UWIT uses the following interpretations for CSAT and PSAT scores:
| Score Range | 1.0 – 2.0 | 2.1 – 3.0 | 3.1 – 3.9 | 4.0 – 4.4 | 4.5 – 5.0 |
|---|---|---|---|---|---|
| CSAT Interpretation | Very Low | Low | Moderate | High | Very High |
| PSAT Interpretation | Misaligned | Strained | Functional | Aligned | Strategic Fit |
CSAT Results by Customer Segment
“Based on your experiences with UWIT-provided technologies or services in the past 12 months, describe your OVERALL satisfaction level with UWIT.”
| Customer Segment | 2026 Score | 2026 Score Interpretation | 2025 Score | Trend |
|---|---|---|---|---|
| All | 4.19 (N = 2,313) |
High | 3.98 (N = 2,093) |
+0.21 |
| Faculty | 4.13 (N = 488) |
High | 3.95 (N = 364) |
+0.18 |
| Student | 4.07 (N = 300) |
High | 4.04 (N = 283) |
+0.03 |
| Staff All | 4.22 (N = 1,471) |
High | 3.98 (N = 1,385) |
+0.24 |
| Staff Partner | 4.14 (N = 409) |
Aligned | 3.92 (N = 331) |
+0.22 |
| Staff User | 4.25 (N = 1,062) |
High | 4.00 (N = 1,057) |
+0.25 |
| Researcher | 4.05 (N = 749) |
High | 3.99 (N = 581) |
+0.06 |
For the purposes of this survey, “Partners” are those respondents who self-identified with the statement “I actively collaborate with UWIT to support the needs of my team, department, or unit. My role depends on regular engagement with UWIT.” (2026 N = 411)
“Rate how much you agree or disagree with the following statements.”
| Statement | 2026 Score | 2026 Score Interpretation | 2025 Score | Relevant UWIT Strategy |
|---|---|---|---|---|
| UWIT offers solutions that are secure | 4.35 | Aligned | 4.42 | Trusted Solutions Anchor |
| UWIT offers solutions that are focused on outcomes | 3.84 | Functional | 3.92 | |
| UWIT offers solutions that are accessible | 3.98 | Functional | 3.98 | |
| UWIT offers solutions that I can trust | 4.18 | Aligned | 4.19 | |
| UWIT understands my needs | 3.52 | Functional | 3.66 | You Get Me Relationships Anchor |
| UWIT cares about my needs | 3.70 | Functional | 3.83 | |
| UWIT offers solutions that fit my needs | 3.70 | Functional | 3.74 | |
| UWIT demonstrates being invested – understanding the impact their work has on others | 3.81 | Functional | 3.96 | Core Values |
| UWIT demonstrates being compassionate – recognizing that behind every inquiry lies a person seeking a meaningful experience | 3.85 | Functional | 3.91 | |
| UWIT demonstrates being team players – collaborating and sharing perspectives in support of a common goal | 3.91 | Functional | 3.96 |
For the purposes of this survey, “Researchers” are those respondents who answered “Yes” to the question “Do you currently conduct research as part of your academic or professional responsibilities at UW?” The 2026 survey introduced a new question format for researchers, measuring satisfaction with individual UWIT services and support resources. Because the questions changed, these results are not directly comparable to 2025. The 2025 researcher results are available under Historical Results.
“Thinking specifically about your research experiences during the past 12 months, please select your satisfaction level with the following UWIT services you used.”
| UWIT Service | All Researchers (N = 888) | Faculty Researchers (N = 379) | Student Researchers (N = 186) | Staff Researchers (N = 299) |
|---|---|---|---|---|
| High Performance Computing (e.g. Hyak, Tillicum) | 3.69 (147 users, 16.6%) | 3.57 (58 users, 15.3%) | 3.75 (44 users, 23.7%) | 3.77 (44 users, 14.7%) |
| Cloud Computing (e.g. AWS, GCP, Azure) | 3.68 (222 users, 25.0%) | 3.58 (90 users, 23.7%) | 3.77 (35 users, 18.8%) | 3.72 (94 users, 31.4%) |
| Research Storage (e.g. Kopah, Lolo) | 3.69 (140 users, 15.8%) | 3.49 (55 users, 14.5%) | 3.69 (29 users, 15.6%) | 3.87 (55 users, 18.4%) |
Cell shading reflects the CSAT score interpretation: Moderate (3.1 – 3.9), High (4.0 – 4.4). Users/usage percentages show how many researchers in each segment used the service.
“Thinking specifically about your research experiences during the past 12 months, please select your satisfaction level with the following UWIT support resources you used.”
| UWIT Support Resource | All Researchers (N = 888) | Faculty Researchers (N = 379) | Student Researchers (N = 186) | Staff Researchers (N = 299) |
|---|---|---|---|---|
| Technical Support Tickets | 3.89 (538 users, 60.6%) | 3.80 (241 users, 63.6%) | 3.79 (76 users, 40.9%) | 4.01 (210 users, 70.2%) |
| Office Hours | 3.97 (258 users, 29.1%) | 3.93 (95 users, 25.1%) | 3.66 (61 users, 32.8%) | 4.18 (96 users, 32.1%) |
| Online and In-Person Trainings | 3.75 (242 users, 27.3%) | 3.74 (84 users, 22.2%) | 3.83 (59 users, 31.7%) | 3.73 (93 users, 31.1%) |
| Online Technical Documentation | 3.71 (394 users, 44.4%) | 3.60 (163 users, 43.0%) | 4.00 (74 users, 39.8%) | 3.67 (148 users, 49.5%) |
Cell shading reflects the CSAT score interpretation: Moderate (3.1 – 3.9), High (4.0 – 4.4). Users/usage percentages show how many researchers in each segment used the support resource.
Customer Effort Score (CES)
Customer Effort Score, or CES, measures the effort that a customer spends in obtaining a desired outcome, such as resolving an issue or fulfilling a request.
UWIT uses two versions of this metric, CES and PES, to measure customers and partners, respectively.
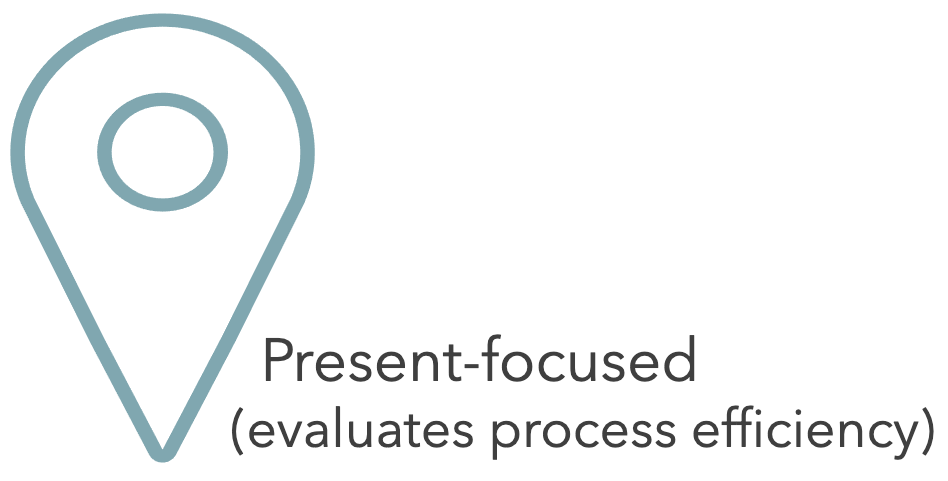
CES/PES are “present-focused” metrics, as they evaluate the current efficiency of a process(es).
UWIT uses the following interpretations for CES and PES scores:
| Score Range | 1.0 – 2.0 | 2.1 – 3.0 | 3.1 – 3.9 | 4.0 – 4.4 | 4.5 – 5.0 |
|---|---|---|---|---|---|
| CES Interpretation | Very High Effort | High Effort | Moderate Effort | Low Effort | Very Low Effort |
| PES Interpretation | Misaligned | Inefficient | Tolerable | Aligned | Strategic Fit |
CES Results by Customer Segment
“Based on your experiences with UWIT-provided technologies or services in the past 12 months, how easy was it to get what you needed from UWIT?”
| Customer Segment | 2026 Score | 2026 Score Interpretation | 2025 Score | Trend |
|---|---|---|---|---|
| All | 3.90 (N = 2,313) |
Moderate Effort | 3.85 (N = 2,093) |
+0.05 |
| Faculty | 3.80 (N = 488) |
Moderate Effort | 3.81 (N = 364) |
-0.01 |
| Student | 3.87 (N = 300) |
Moderate Effort | 3.82 (N = 283) |
+0.05 |
| Staff All | 3.94 (N = 1,471) |
Moderate Effort | 3.87 (N = 1,385) |
+0.07 |
| Staff Partner | 3.78 (N = 409) |
Tolerable | 3.73 (N = 331) |
+0.05 |
| Staff User | 4.00 (N = 1,062) |
Low Effort | 3.91 (N = 1,057) |
+0.09 |
| Researcher | 3.71 (N = 749) |
Moderate Effort | 3.80 (N = 581) |
-0.09 |
Net Promoter Score (NPS)
Net Promoter Score, or NPS, is a customer loyalty metric that measures how likely customers are to recommend an organization’s products or services to others. UWIT surveys our customers and partners (students, faculty, staff, researchers) across all three UW campuses to collect this feedback.
UWIT uses two versions of the NPS metric, cNPS and pNPS, to measure customers and partners, respectively.
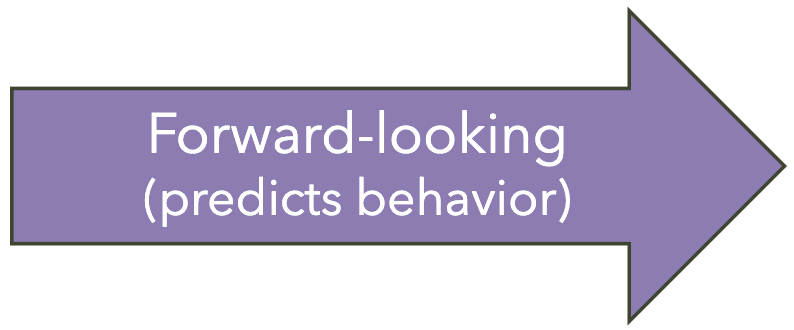
NPS is a “forward looking” metric, as it predicts customers’ future behavior.
UWIT uses the following interpretations for cNPS and pNPS scores:
| Score Range | -100 – 0 | 1 – 30 | 31 – 50 | 51 – 70 | 71+ |
|---|---|---|---|---|---|
| cNPS Interpretation | Poor | Acceptable | Great | Excellent | World Class |
| pNPS Interpretation | At Risk | Stable | Strong | Strategic Partner | Trusted Advisor/Ally |
NPS Results by Customer Segment
“Based on your experiences with UWIT-provided technologies or services in the past 12 months, how likely are you to recommend UWIT to a colleague or peer?”
| Customer Segment | 2026 Score | 2026 Score Interpretation | 2025 Score | Trend |
|---|---|---|---|---|
| All | 31 (N = 2,313) |
Great | 35 (N = 2,093) |
-3.9 |
| Faculty | 27 (N = 488) |
Acceptable | 39 (N = 364) |
-11.7 |
| Student | 19 (N = 300) |
Acceptable | 25 (N = 283) |
-6.0 |
| Staff All | 34 (N = 1,471) |
Great | 35 (N = 1,385) |
-0.5 |
| Staff Partner | 33 (N = 409) |
Strong | 31 (N = 331) |
+2.3 |
| Staff User | 34 (N = 1,062) |
Great | 37 (N = 1,057) |
-2.1 |
| Researcher | 20 (N = 749) |
Acceptable | 54 (N = 581) |
-33.4 |
Historical Results
The 2025 UWIT Customer & Partner Experience Survey was distributed to all UW students, faculty, staff and researchers (UW population groups) across all three campuses in April 2025. The survey achieved statistically significant response rates across all UW population groups, with 2,440 total responses.
Additionally, the survey successfully established baseline metrics for UWIT’s You Get Me Relationships strategic anchor that will be measured and acted upon annually as UWIT strives to continuously align its priorities and portfolio with the needs of the UW community.
2025 Key Takeaways
- UWIT maintains positive satisfaction scores across all metrics for all population groups, meaning that UWIT is meeting the needs of the majority of its customers and partners.
- Improvement opportunities exist in software availability (particularly Adobe Creative Suite and AI tools) and continuing to improve service delivery fundamentals focused on making it easier for customers and partners to get what they need from UWIT.
Acting on Feedback
In response to the 2025 survey results, UWIT is launching targeted efforts to improve customer and partner experiences. These initiatives directly address the feedback we received and are part of UWIT’s ongoing commitment to strengthening services and supporting the UW community.
Reducing Customer and Partner Effort
UWIT kicked off our You Get Me Relationships (YGMR) Commitments Program to help our service teams be more responsive to reduce the effort it takes our customers and partners to get what they need from us. Visit the UWIT Metrics page for current responsiveness results.
Inclusive software planning
UWIT is building a new software planning webpage that lets the UW community see what new software is being considered, suggest new tools, and share input on proposed software. It’s in testing now and scheduled to launch in 2026 Q3. (Update, Sept 2026: the Software Request Dashboard is now live.)
Over the last year, UWIT worked with campus partners to add more software options than ever before, including Canva, ChatGPT, Lucidchart, Copilot Chat, GitHub Copilot, PowerApps, Power Automate and others. You can find everything available in the UW Software Catalog (UWare).
2025 Researcher Results
The 2025 survey measured researcher experience by research activity, and asked separately about IT tools and IT support. The 2026 survey replaced these questions with per-service and per-support-resource satisfaction measures, so the results below are not directly comparable to the current-year researcher results. They are retained here for reference.
2025 CSAT (IT tools / IT support) by Researcher Segment
“Thinking specifically about your research experiences during the past 12 months, please select your satisfaction level with the IT tools and IT support provided by UWIT.”
| Researcher Segment | 2025 Scores (IT tools/IT support) |
Score Interpretation |
|---|---|---|
| All Researchers | 3.75 / 3.83 | Moderate |
| Faculty Researcher | 3.66 / 3.73 | Moderate |
| Student Researchers | 3.84 / 3.92 | Moderate |
| Staff Researchers | 3.77 / 3.86 | Moderate |
| Activity | 2025 Scores (IT tools/IT support) |
Score Interpretation |
|---|---|---|
| Using High Performance Computing (e.g. Hyak) | 3.69 / 3.88 | Moderate |
| Using Cloud Computing (e.g. AWS, GCP, Azure) | 3.69 / 3.82 | Moderate |
| Using Research Storage (e.g. Kopah, Lolo) | 3.76 / 3.89 | Moderate |
| Using Research Computing Consulting (e.g. office hours) | 3.54 / 3.70 | Moderate |
2025 CSAT (Overall satisfaction) by Research Activity
“Based on your experiences with UWIT-provided technologies or services in the past 12 months, please select your OVERALL satisfaction level with UWIT.”
| Activity | 2025 Score | Score Interpretation |
|---|---|---|
| Using High Performance Computing (e.g. Hyak) | 4.07 | High |
| Using Cloud Computing (e.g. AWS, GCP, Azure) | 3.98 | Moderate |
| Using Research Storage (e.g. Kopah, Lolo) | 3.94 | Moderate |
| Using Research Computing Consulting (e.g. office hour) | 3.81 | Moderate |
2025 CES by Research Activity
“Based on your experiences with UWIT-provided technologies or services in the past 12 months, how easy was it to get what you needed from UWIT?”
| Activity | 2025 Score | Score Interpretation |
|---|---|---|
| Using High Performance Computing (e.g. Hyak) | 3.75 | Moderate Effort |
| Using Cloud Computing (e.g. AWS, GCP, Azure) | 3.67 | Moderate Effort |
| Using Research Storage (e.g. Kopah, Lolo) | 3.76 | Moderate Effort |
| Using Research Computing Consulting (e.g. office hour) | 3.57 | Moderate Effort |
2025 NPS by Research Activity
“Based on your experiences with UWIT-provided technologies or services in the past 12 months, how likely are you to recommend UWIT to a colleague/peer?”
| Activity | 2025 Score | Score Interpretation |
|---|---|---|
| Using High Performance Computing (e.g. Hyak) | 28 | Acceptable |
| Using Cloud Computing (e.g. AWS, GCP, Azure) | 33 | Great |
| Using Research Storage (e.g. Kopah, Lolo) | 38 | Great |
| Using Research Computing Consulting (e.g. office hour) | 18 | Acceptable |
2025 Survey Results
Read the complete results (PDF) of the 2025 UWIT Customer & Partner Experience Survey.
Questions or Feedback?
We recommend visiting the FAQs for 2026 UWIT Customer & Partner Experience Survey page. If your question isn’t addressed there, please submit the Customer & Partner Survey Feedback form.