Development of the new Period 1 Registration Metrics Tableau workbook started with a question: “can we make this process easier?”
For Ammy Phuwanartnurak, a Service Manager/Business Analyst on UW-IT’s Student & Educational Technology Services (SETS) team, this question surfaced during her quarterly push to gather Period 1 registration metrics. Every Fall, Winter, and Spring quarter*, she compiled registration data on student groups, transactions, and courses, then calculated the year-over-year growth rate for each day in the Period 1 window.
*Note: Summer quarter Period 1 registration is different than other quarters and does not have a high traffic load, so it is excluded from this tool.
This process, while important for her stakeholders, required hours of gathering data and working through spreadsheets. The new Period 1 Registration Metrics workbook automates this task, while providing stakeholders with accurate, timely insights into how students are registering during Period 1 window.
This workbook is hosted on UW-IT’s Tableau server with access managed via a UW Group. Although not widely available, this workbook shows a powerful data solution that emerged from cross-team collaboration.
What is Period 1 Registration?
Period 1 registration is the first window when continuing students can register for classes, with access opening on different dates based on class standing, earned credits, and other considerations. Students receive assigned registration dates and can make schedule changes throughout the period. For more information, refer to Registration Periods.
Collaborating to Meet Requirements
Creating this workbook was a cross-team effort! Ammy Phuwanartnurak from the SETS team provided the requirements and feedback, while Grzegorz (Greg) Grabowski from the Business Intelligence (BI) team developed the workbook and the dashboards within it.
About the Workbook
The Period 1 Registration Metrics workbook displays data in multiple dashboard tabs, each tailored to answer specific questions, which are explored below.
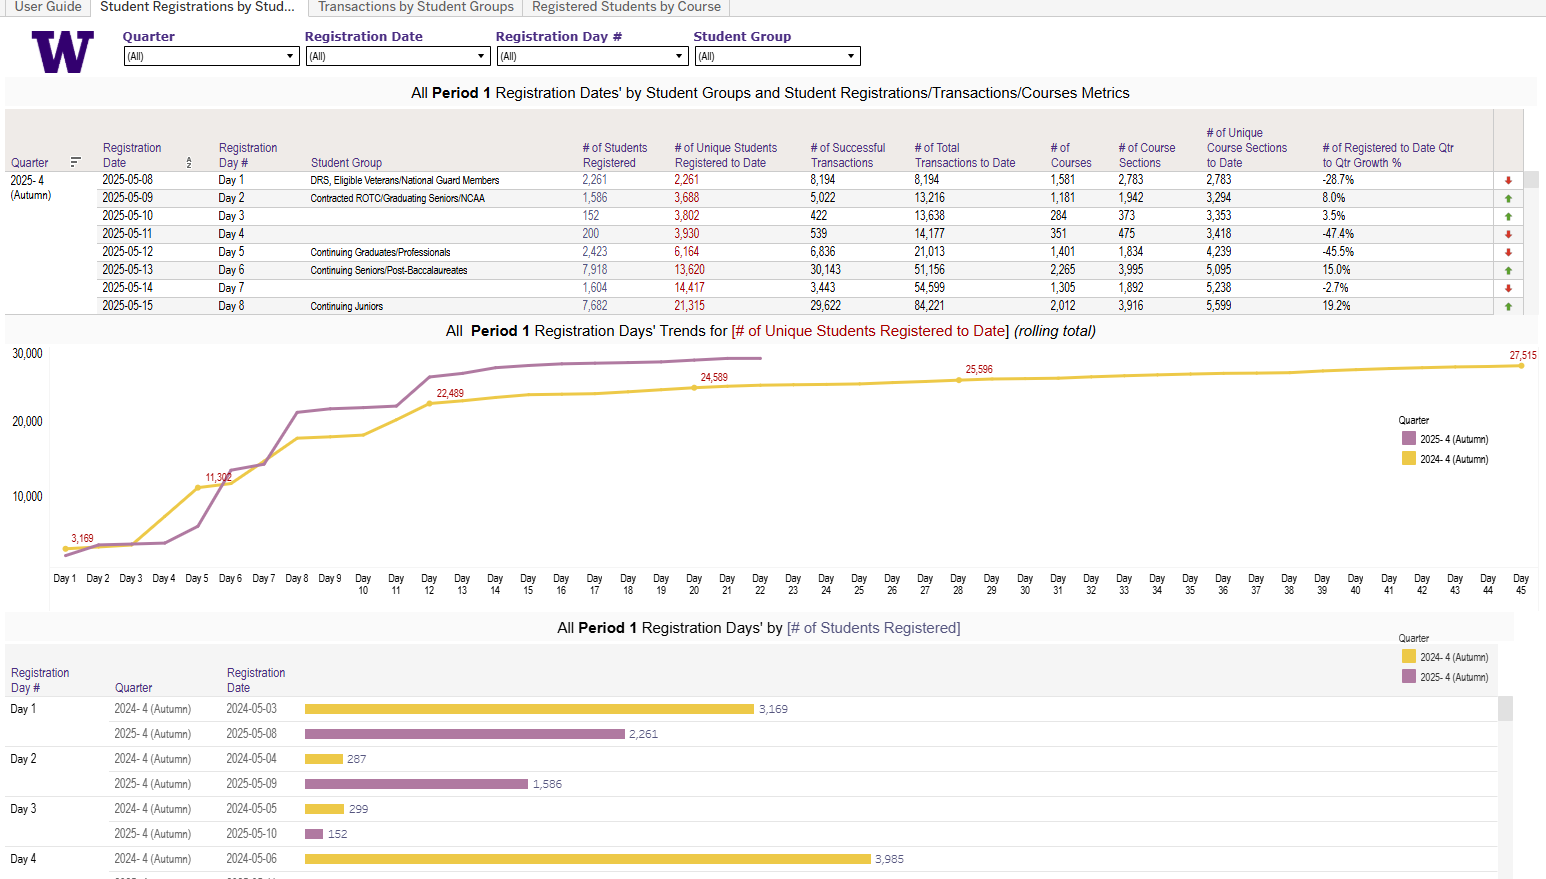
Student Registrations by Student Groups
This dashboard answers the following questions:
- Which student groups participated in Period 1 registration?
- How many students registered during the current quarter’s Period 1 window and how does this compare to the same period last year?
- What’s the daily and cumulative registration headcount (both unique and duplicated)?
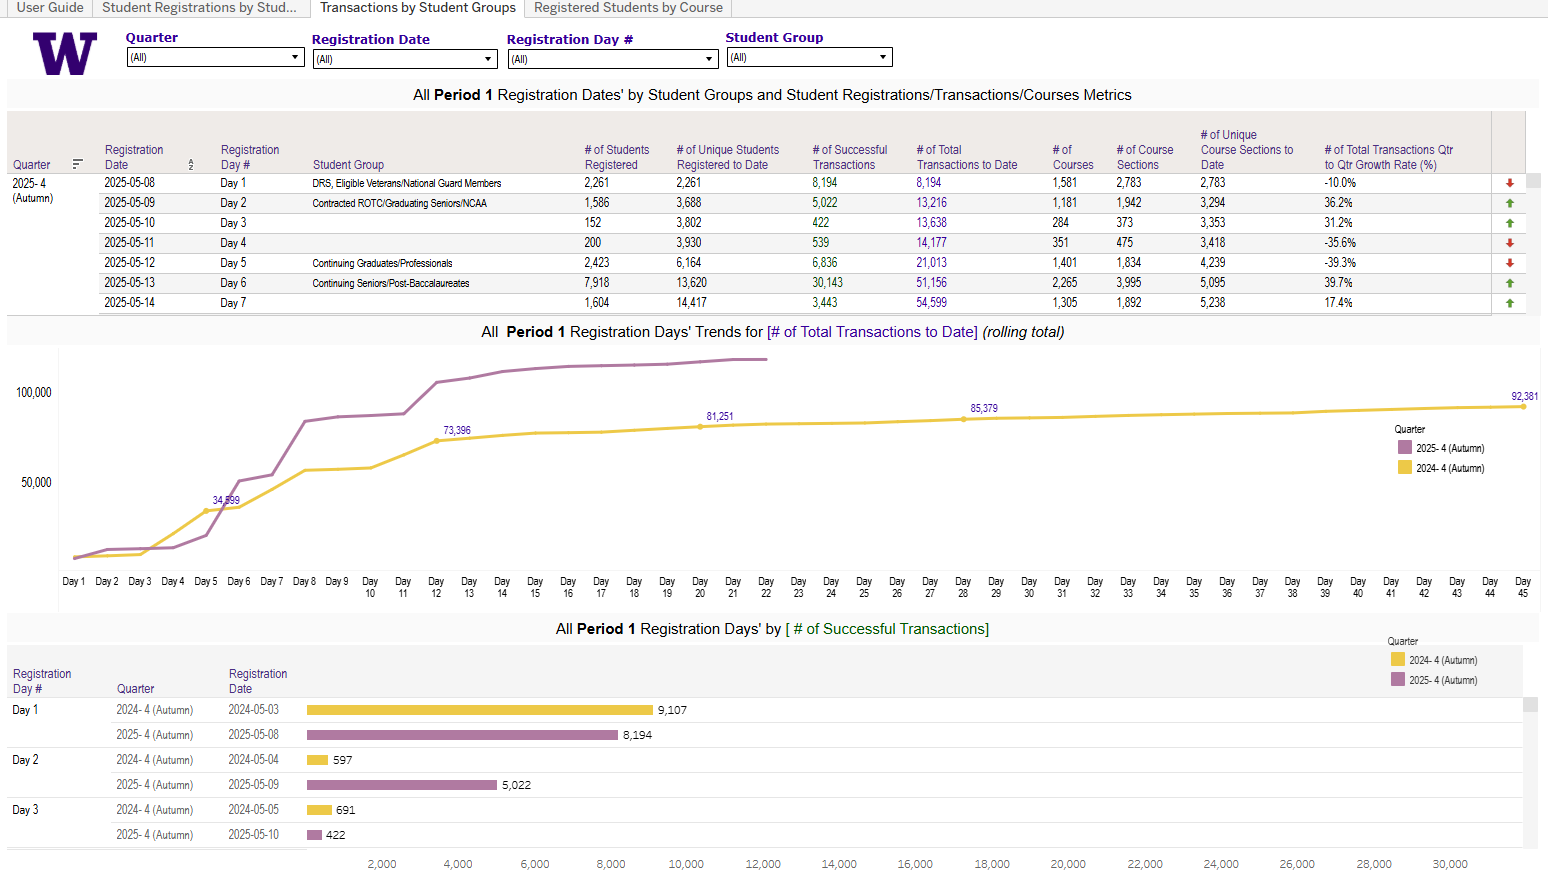
Transactions by Student Groups
This dashboard answers the following questions:
- How many successful registration transactions were completed each day during Period 1?
- What’s the total volume of transactions (successful and unsuccessful)?
- Are transaction volumes increasing, decreasing, or consistent compared to last year?
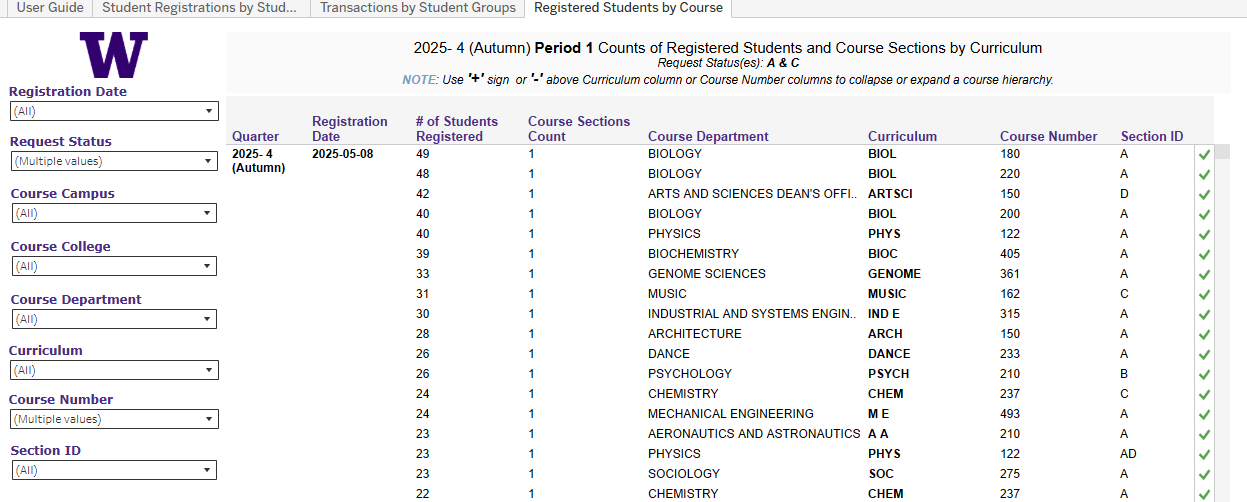
Registered Students by Course
This dashboard answers the following questions:
- What courses are students registering for during Period 1?
- How many students are registered in specific courses, on a daily or cumulative basis?
- What are the most and least popular courses during this registration period?
Questions/Feedback/Ideas?
Do you have a question about this workbook and/or a request for a new resource in the BI Portal? Please submit a ticket to help@uw.edu with “BI Portal” in the subject line.