August 26, 2026
Supporting Student Progress: The Bottleneck and Gateway Course Dashboard
A student’s path to a degree depends on their ability to access the courses they need when they need them. However, when high-demand or foundational courses are difficult to access or complete, they can become barriers for students, causing them to delay progress to a degree or deviate from their intended path.
UWIT’s new Bottleneck and Gateway Course dashboard uses registration and course data to identify where these barriers occur. With this information, the university can take targeted actions—such as opening additional sections or expanding capacity in high-demand courses—to reduce delays and improve time to degree. In doing so, the dashboard supports Objective 1.a. of the UW Strategic Framework for 2026-2030 which aims to “increase access to capacity-constrained majors…and accelerate efforts to ensure every student graduates in a timely fashion.”
From Model to Dashboard
Back in 2021, before Objective 1.a. was an official part of the strategy, UWIT’s Analytics team developed a model to identify courses that significantly influence a student’s progress through a major. This model, made available to students via DawgPath, supports informed decision-making for students considering a new direction, exploring academic options, or facing capacity constraints in a major.
With the model available in DawgPath, the team continued to iterate, shifting their focus from helping individual students explore pathways to helping campus understand the course conditions that can influence those pathways. The model evolved into the Bottleneck and Gateway Course dashboard, which brings the analysis into a format that academic and administrative partners can use to identify patterns, ask better questions, and consider targeted actions.
A Collaborative Effort
The dashboard reflects contributions from partners across UWIT and campus:
- UWIT Analytics – Developed and refined the model; collaborated with campus partners to understand requirements; and partnered with other UWIT teams to translate the model into the dashboard.
- UWIT User Experience Design – Collaborated with UWIT Analytics on the dashboard prototype.
- UWIT Business Intelligence – Developed the dashboard in Tableau and iterated the solution based on feedback from partner teams.
- Office of the University Registrar – Provided requirements and helped establish connections with interested campus partners.
- Continuum College – Served as a user representative.
- Provost’s Office – Served as the data steward.
About the Dashboard
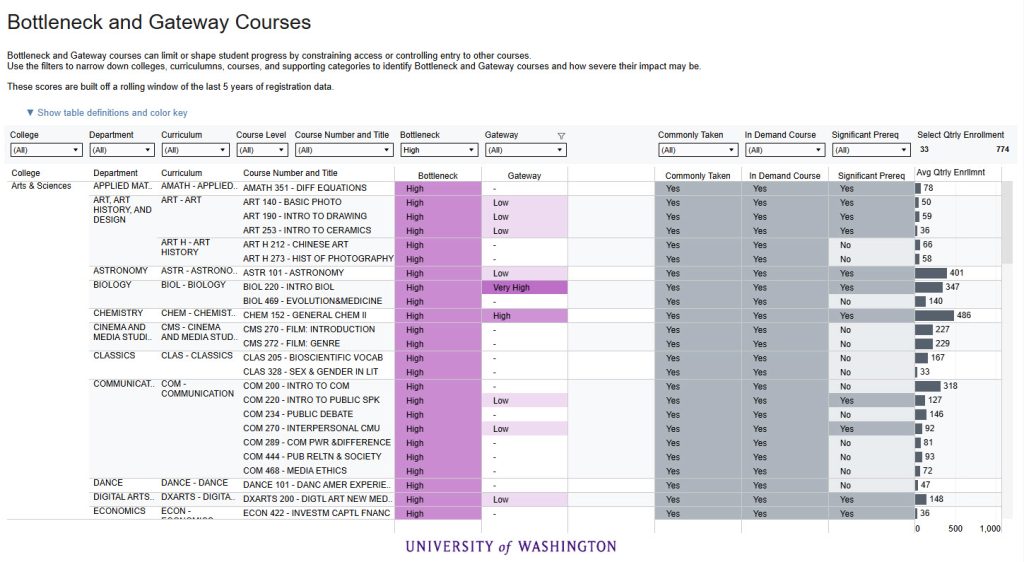
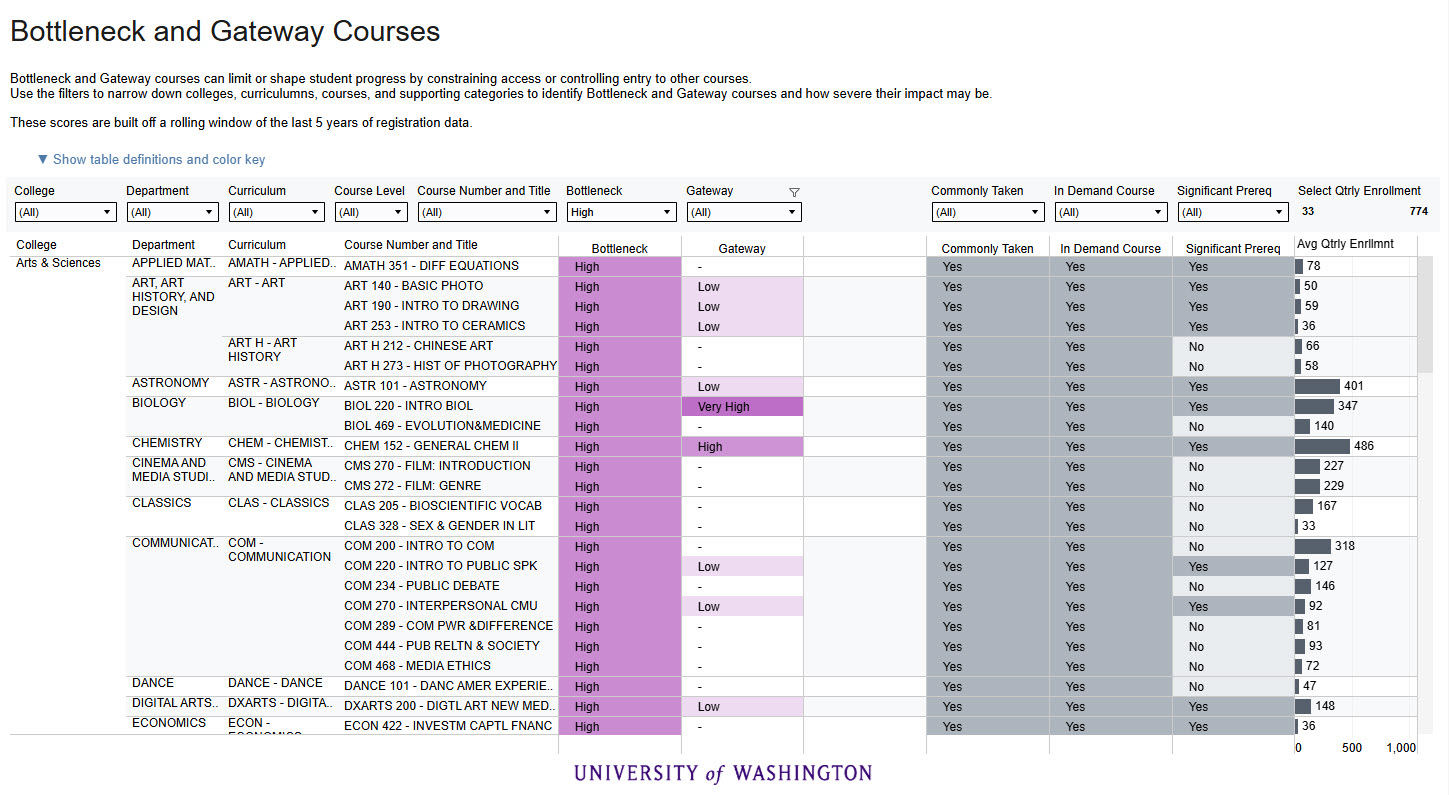
The Bottleneck and Gateway Course dashboard focuses on two ways a course can play an important role in student progress:
- Bottleneck Courses are courses that are commonly taken by students in at least one major and are in high demand. Students may have an unusually hard time getting into these courses, which can delay progress when the course is required in an academic path.
- Gateway Courses are courses that are commonly taken by students in at least one major and can help open access to additional coursework. They are typically lower-division courses with few or no prerequisites and lead to other courses that students commonly take.
Users can apply filters to narrow down results by college, curriculum, course, and supporting categories to identify bottleneck and gateway courses and inform decisions on what courses may need to be added to address them.
 Accessing the Dashboard
This dashboard is available to users with either the Academic Analyst or Advisors/Academic Staff security roles. To request access, submit the Reports, Analytics, and Data Access Request form.
Learn More
To learn more about the model behind the dashboard, as well as plans for future development, refer to the Degree Bottleneck and Gateway Identification white paper.